Returns analysis of a british company
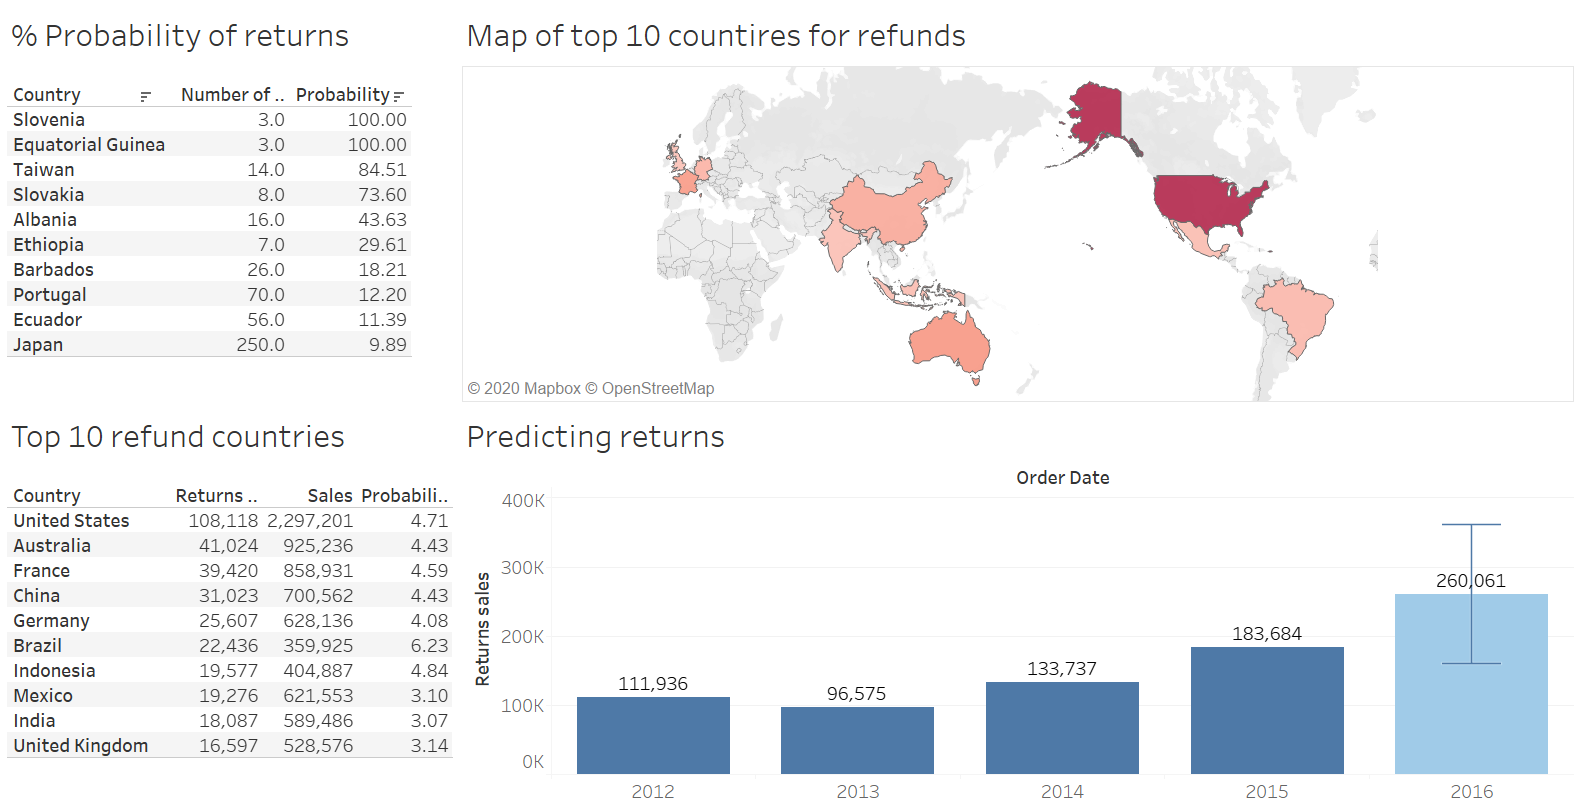
A British company has been growing its business since its infancy stage. Their sales have been good as they deal with Office infrastructure. However, the VP Sales is not very happy with the refunds that the Company has been providing to its Customers. The VP wanted a decision driven method to be employed rather than a traditional approach to derive a strategy.
Solution –
As a first step the VP planned to evaluate all the BI tools available in the market. Tableau was selected as it met his requirements. Using Tableau, he wanted his team members to give him the forecast of Sales for the next year as well as the probability of refunds category wise for a year. This will help him plan his next steps to avoid the refunds. He wanted a dashboard that would contain the following:
- A list of Order returned by the Customers from Top 10 Countries (in terms of refund)
- Top 10 Countries mapped on the World Map that had most of the refunds
- Predict the refund for next 1 year category-wise
About the data:
- The data is in .xlsx format and has multiple sheets.
- We will select the returns and orders sheets such that we left join returns on orders. This will ensure that we will have all the orders data required for further calculations.
Calculated fields:
| Measure name | Formula |
|---|---|
| Return Sales | IF [Returned] = “Yes” THEN [Sales] END |
| Probability | SUM(Returned Sales)/SUM(Sales) |
Actions to be Performed to Create the Dashboard:
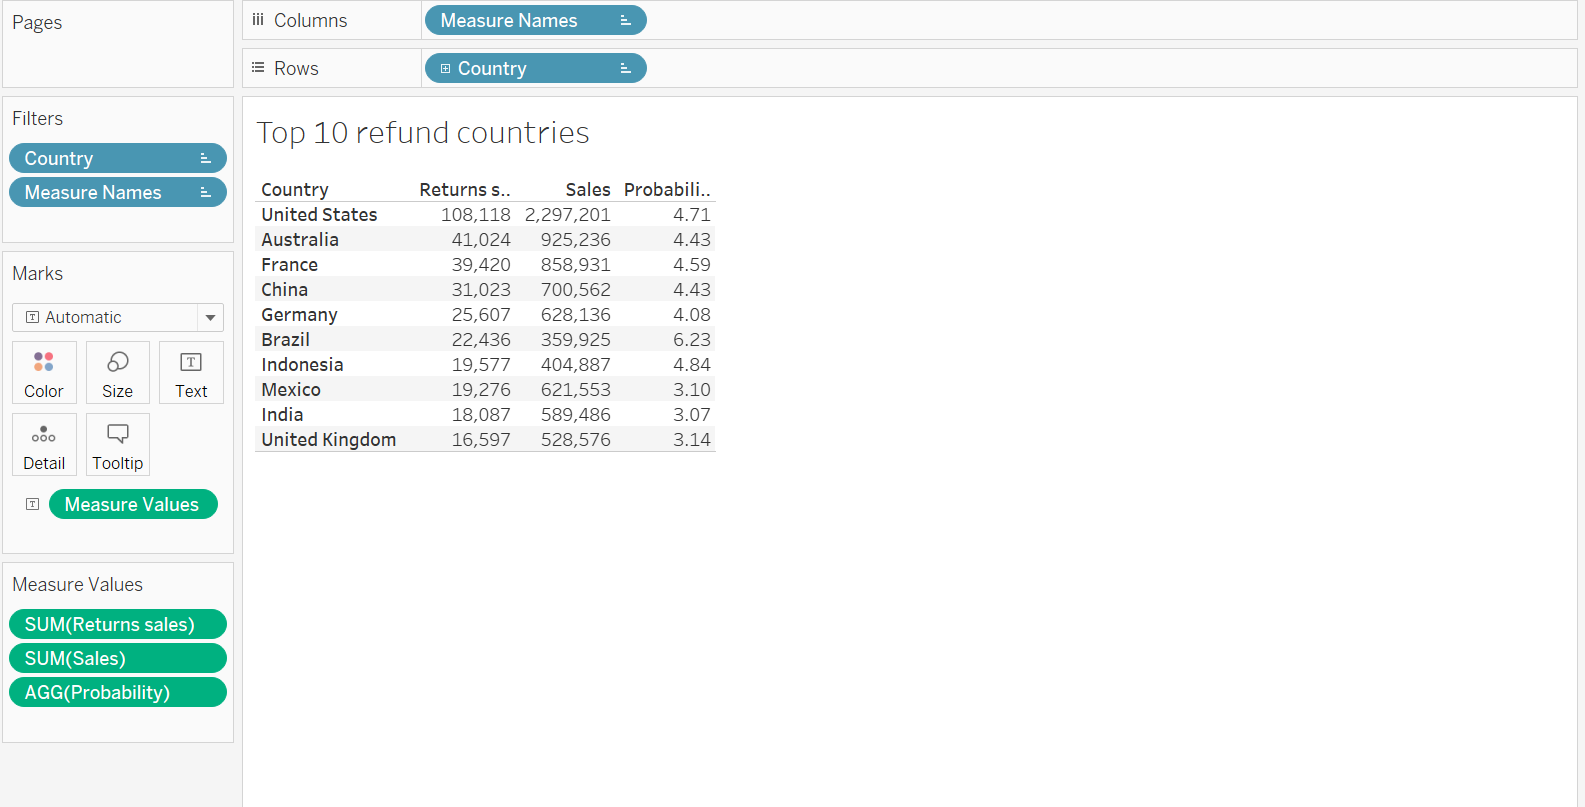
1. Generate a list of order returned from customers and compare it to the original sales, sort the visualization in ascending order in terms of returned order, for top 10 countries in terms of refunds.
Procedure followed:
- Select Country and drag into rows field.
- Select SUM(Sales) and drag into marks. Select type as label.
- Select SUM(Return Sales) and drag into marks. Select type as label.
- Select AGG(Probability) and drag into marks. Select type as label.
- Apply filter by dragging country dimension into filter and select top 10 by sales.
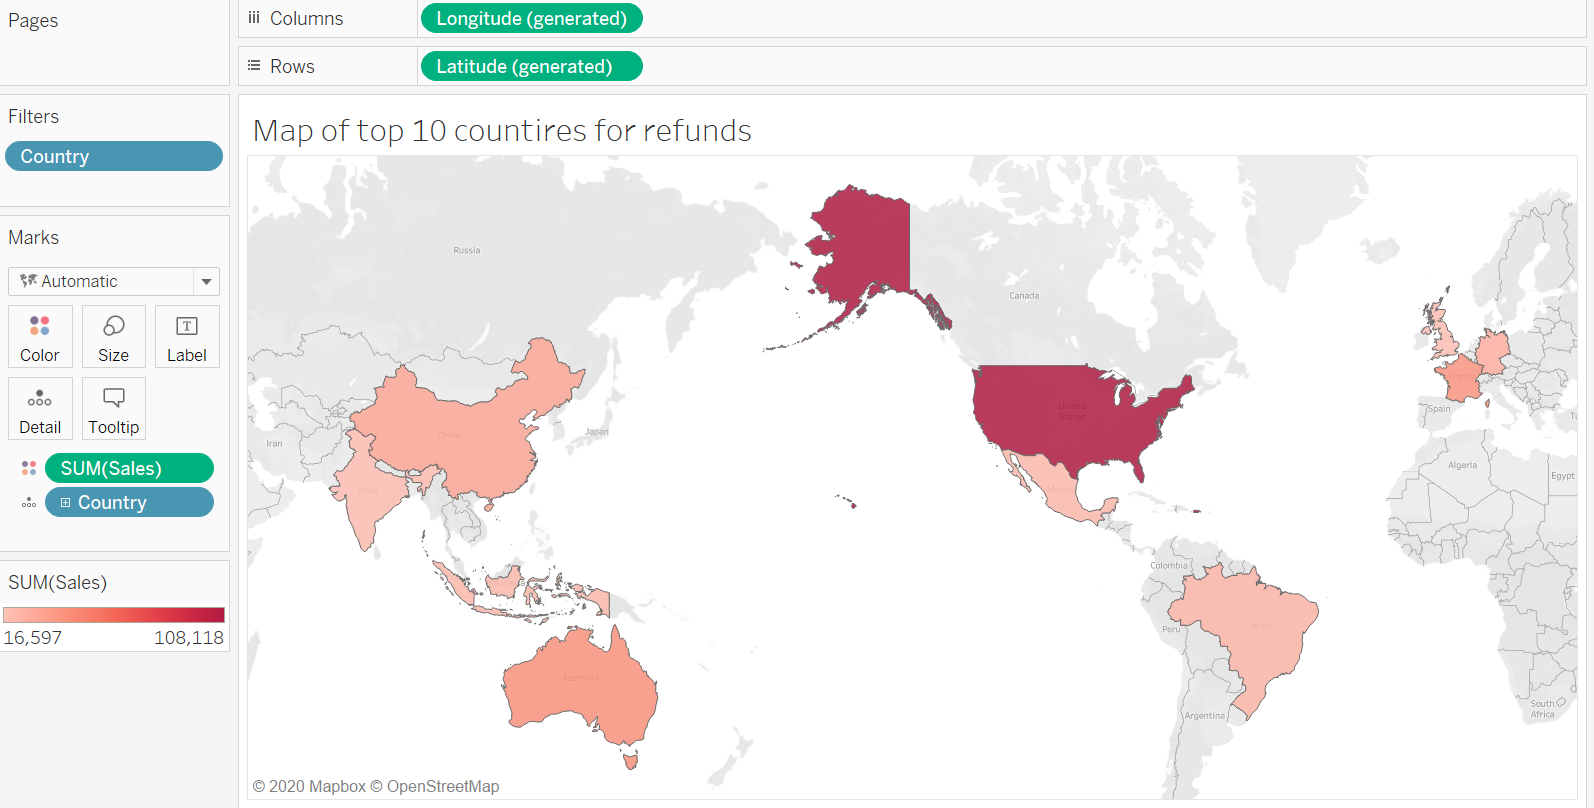
2. Map top 10 countries, with most of the refunds on the world map.
Procedure Followed:
- Drag country into marks which automatically selects latitude and longitude data created by Tableau into Columns and Rows respectively.
- Select SUM(Sales) and drag into marks. Select type as color.
- Added URL action to each website to open its wikipedia page for more info on the country. Under worksheet go to actions and select add action to add url.
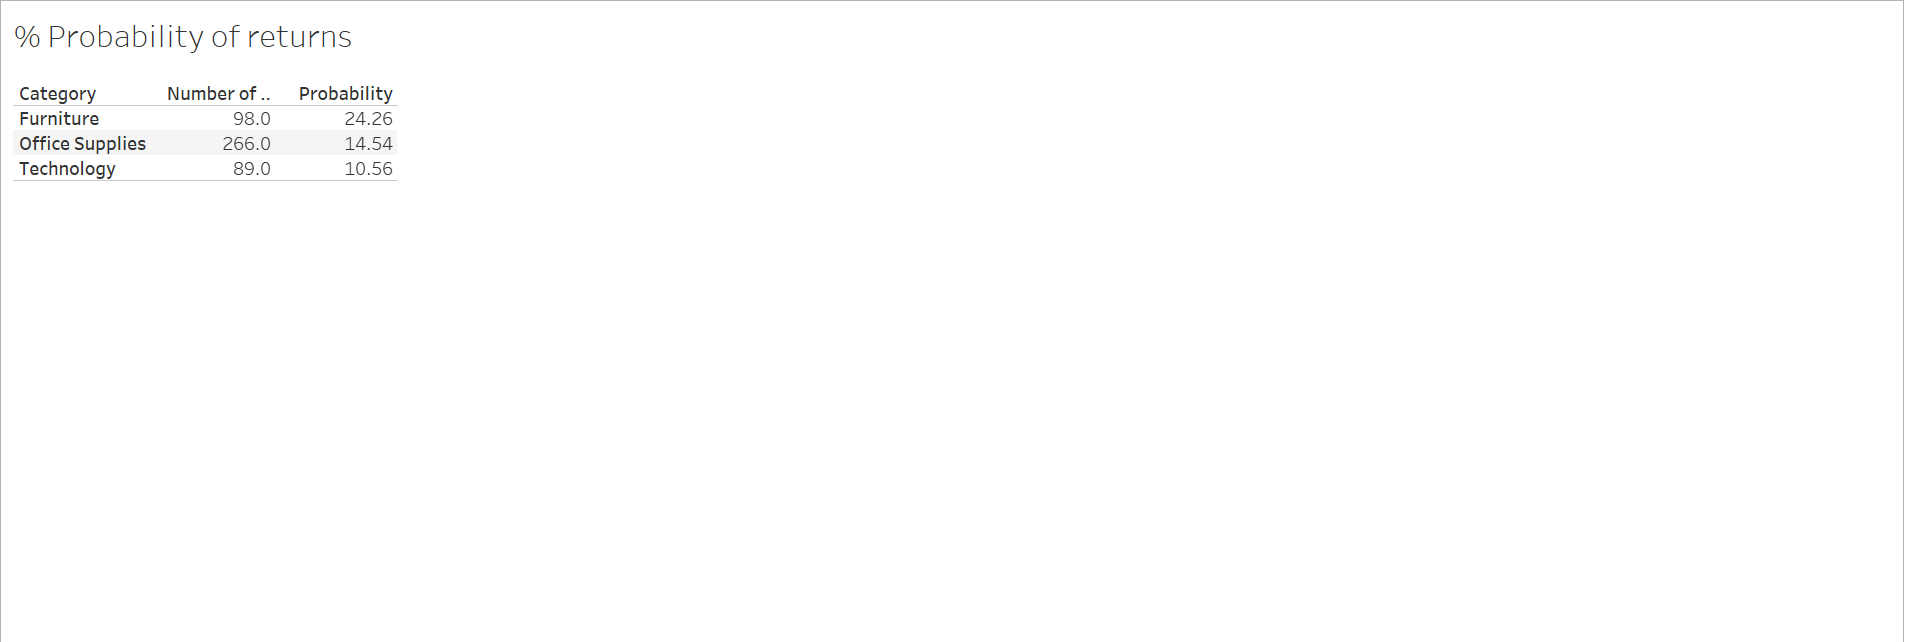
3. Find the probability % of returns by category.
Procedure followed:
- Drag category into rows field.
- Drag SUM(Return Sales) into marks and select type as label.
- Drag number of records into marks and select type as label. Drag AGG(Probability) into marks and select type as label.
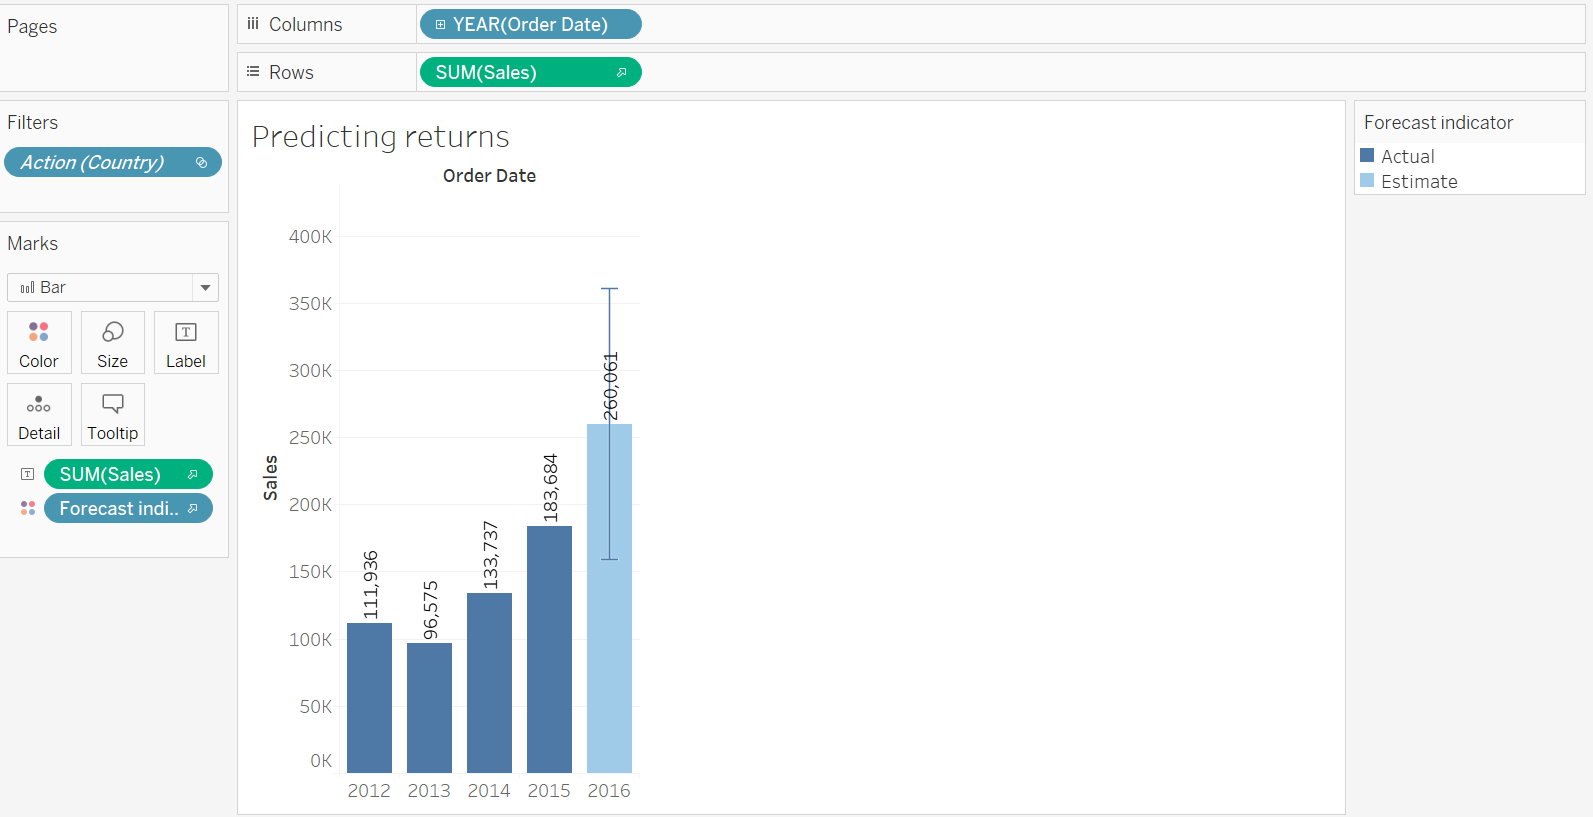
4. Predict the returned sale with lowest and actual forecast of the data and Add a URL action to represent details of the countries.
What is trend and seasonality?
The trend and seaonality are veteran marketing concepts that have been used by many companies. Trend shows us how well a product does over an entire year. Seasonality on the other hand shows us when are we likely to see a high number of sales and when are we going to have a slow period. Both trend and seasonality tend to be similar to previous years for companies making them a vital tool for forecasting.
Procedure followed:
- Dragged Sales as sum into rows field.
- Dragged Order date as YEAR into columns field.
- Under analysis—>Forecast we select show forecast.
- Next we chose a bar graph to create a comparative study.
- Finally we drag the forecast indicator into marks and give it the type color.
- We also drag Sales as SUM into marks to display returned sales value for each year.
Conclusion:
-
We have seen maximum number of refunds from United States. The company must get to the bottom of why has it seen so many refunds from the country. What is interesting is that the % probability of returns is around 5% which is a good thing but should be worked upon. Further analysis will be required.
-
Looking at the % Probability by category we see that furniture has the highest probability for returns. There could be various reasons not stated to us. Could be damage to goods during transport or manufacturing defects. This should be looked upon further.
-
Looking at forecasts for the returns, if nothing is done, we can estimate an almost 100% increase in returns.
Project Files:
Please find the project files here.
