Analyzing HR data to see employee distribution

Analysis to be done:
-
Create a Histogram to find the Employee Statisfaction level.
-
Create a Histogram to find the Employee Monthly Hours Distribution Level.
-
Employee Department Wise Distribution.
-
FInd the Employee Project Count Turnover Distribution.
-
Find the Employee turnover depending on years worked distribution.
-
Create a Dashboard to using the above visuals.
Description of the data:
| Columns | Dimension/Measure |
|---|---|
| Average Montly Hours (bin) | Dimension |
| Last Evaluation (bin) | Measure |
| Number of Records | Measure |
| Satisfaction Level (bin) | Measure |
| Time Spend Company (group) | Dimension |
| Work accident | Measure |
| Average Montly Hours | Measure |
| Last Evaluation | Measure |
| Left the company (left) | Measure |
| Number Project | Dimension |
| Promotion Last 5Years | Measure |
| Salary | Dimension |
| Department | Dimension |
| Satisfaction Level | Measure |
Create a Histogram to find the Employee Statisfaction level.
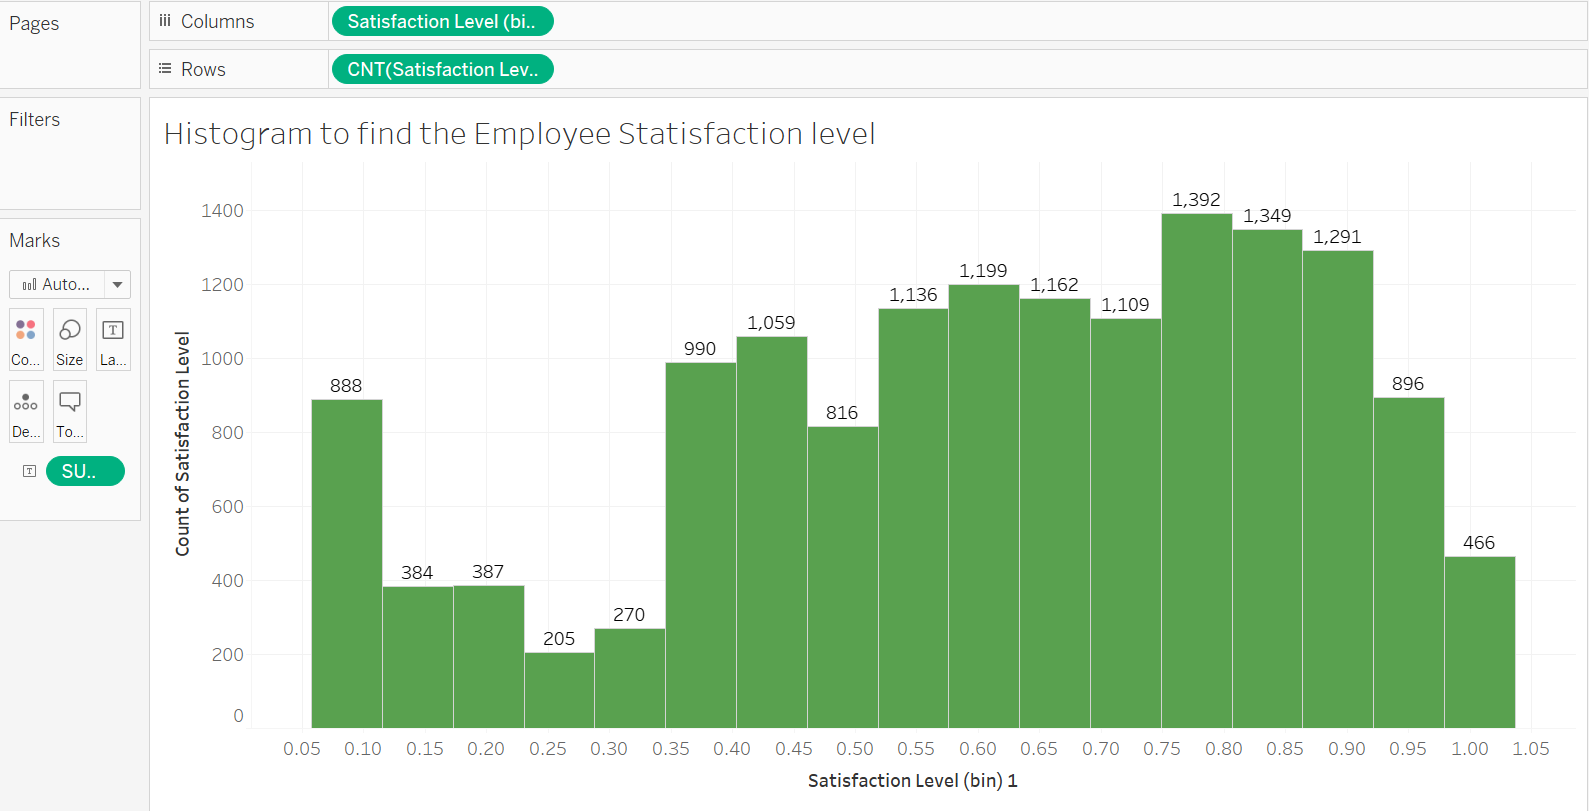
Procedure followed:
- Drag Satisfaction Level into columns field.
- Drag Satisfaction Level into rows field and select count.
- Drag Number of records into marks and select sum to show total records for each bin.
- Now select histogram in graphs.
- We are using a histogram here since we want to display the distribution of the data of employees across the company.
Create a Histogram to find the Employee Monthly Hours Distribution Level.
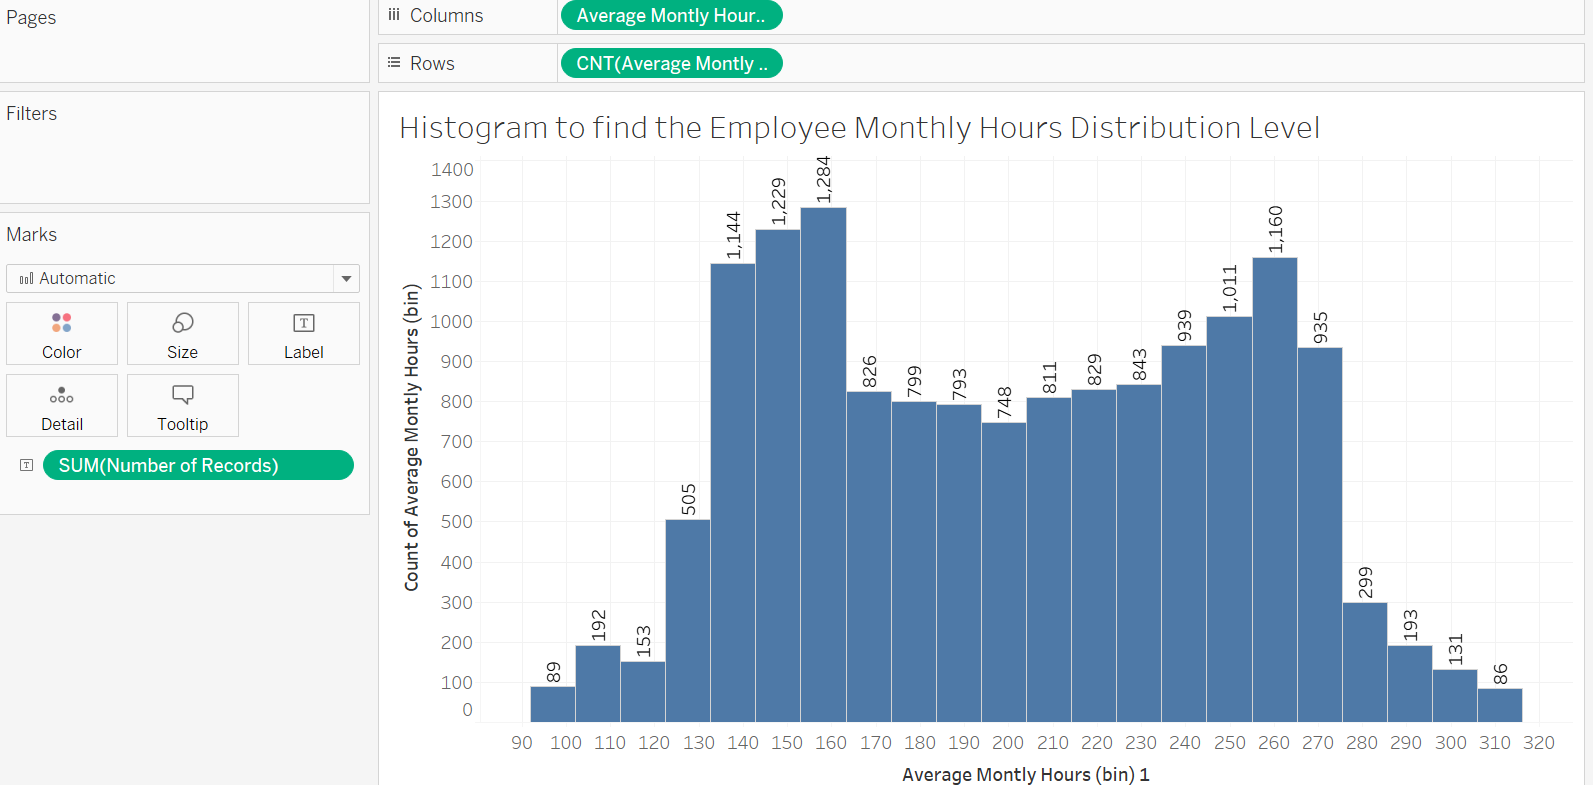
Procedure followed:
- Drag Average Monthly hours measure into columns section.
- Drag Aaverage monthly hours into rows section and select count as measure option.
- Drag number of records into marks and select Sum as measure option. For type select text to display the number of records.
- Select histogram as type of visual since it is ideal for showing data distribution.
Employee Department Wise Distribution.
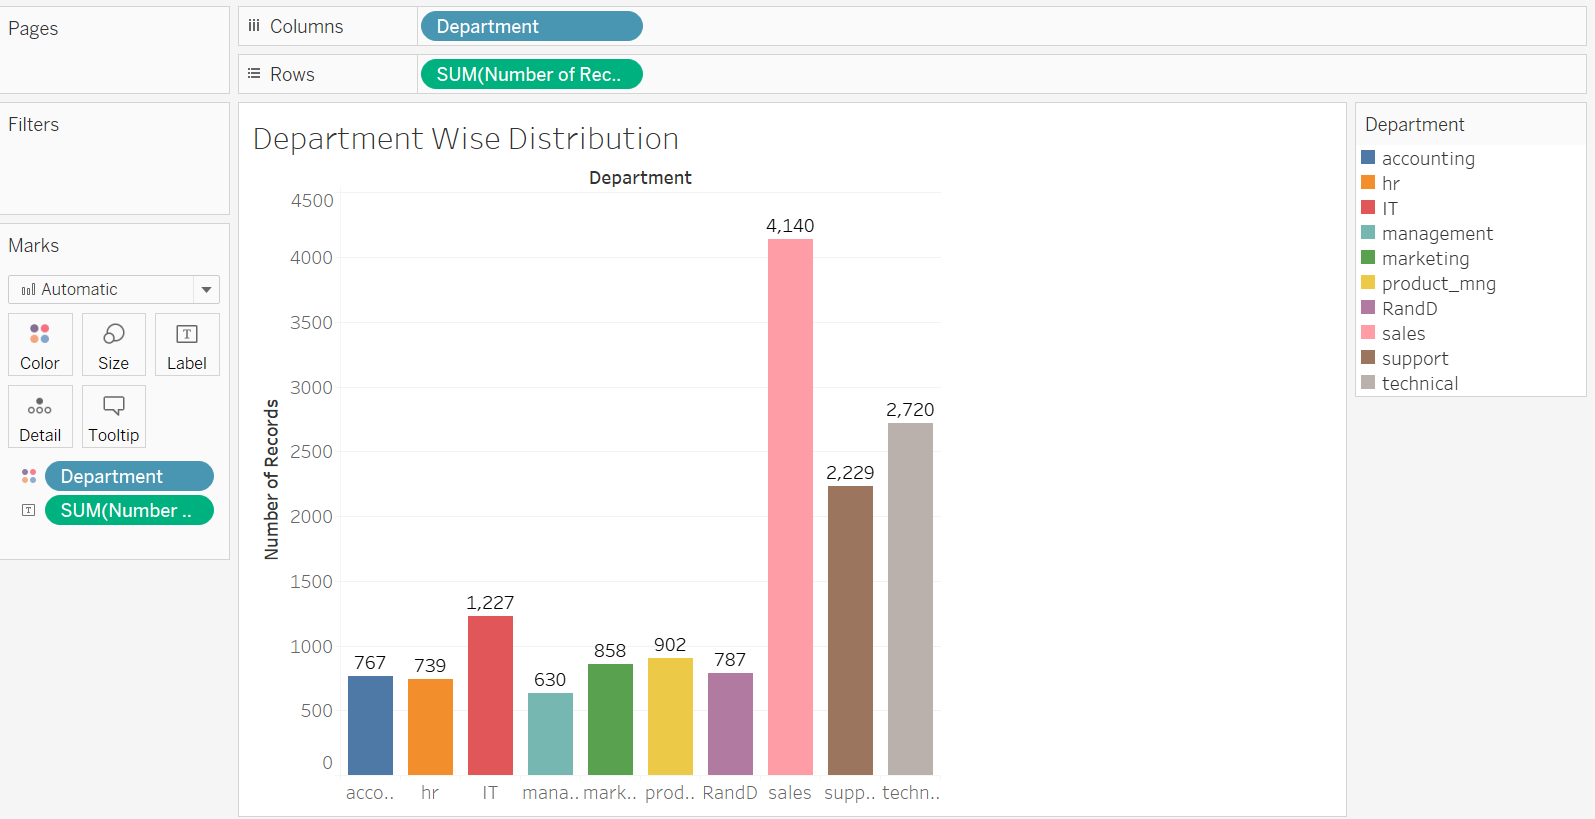
Procedure Followed:
- Drag department into the column field.
- Drag number of records and select sum into rows field.
- Drag department into marks and select type as color to differentiate between each department.
- Drag Number of records and select sum into marks to show the values for each department.
- We use a bar chart here since we want to compare number of employees by department.
Employee Project Count Turnover Distribution.
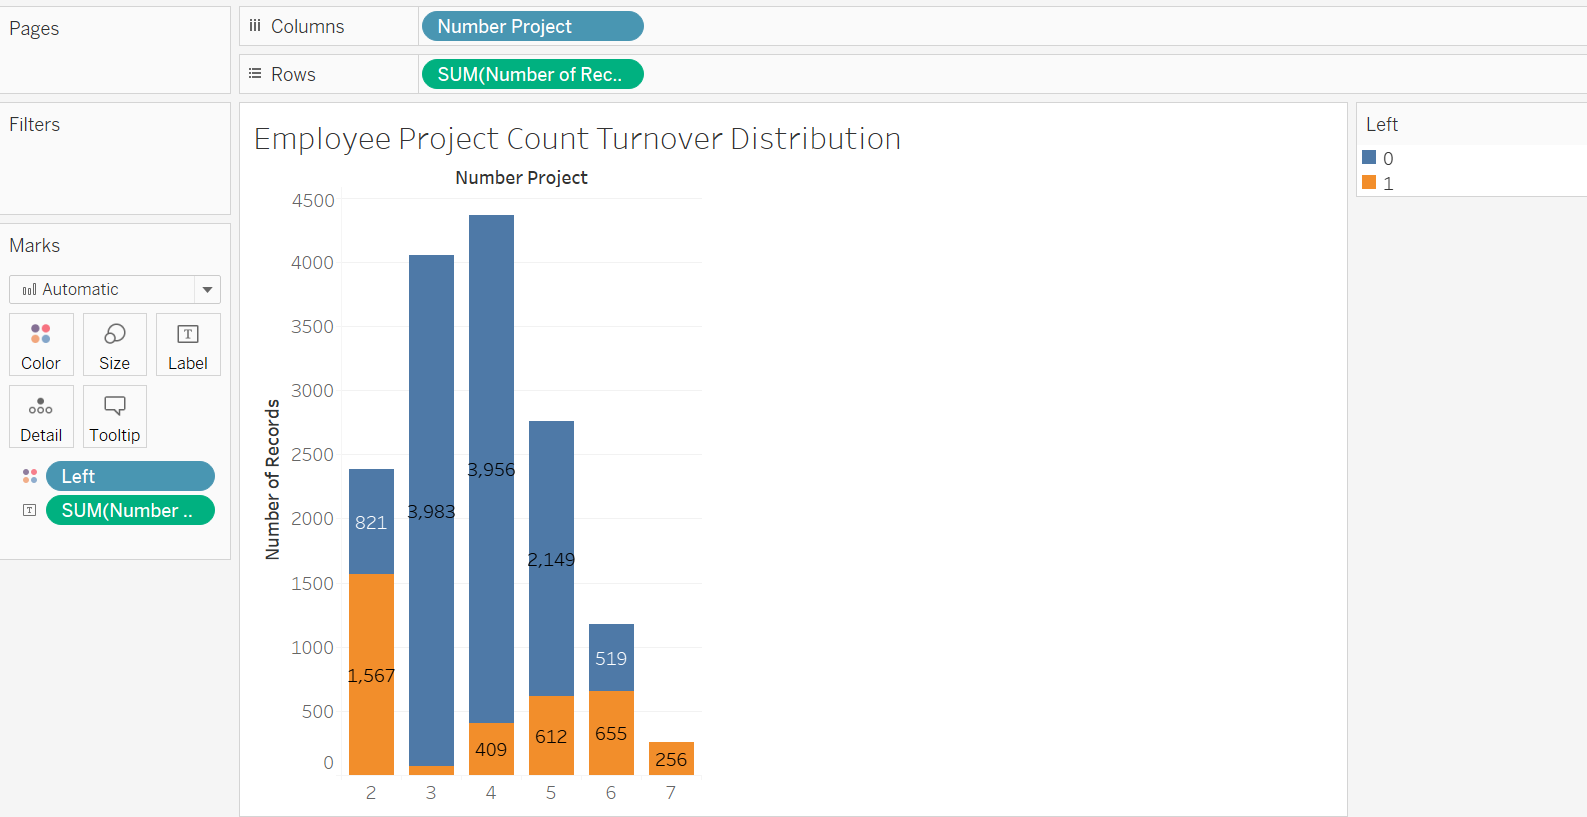
Procedure followed:
- Drag number project measure into columns section.
- Drag Number of records into rows section and select sum for measure.
- Drag Number of records into marks section and select sum to display number of records and select type as text.
- Drag left measure into marks and select color to see how many employees left from a certain project.
- We select horizontal bar chart and we change its orientation to vertical.
Find the Employee turnover depending on years worked distribution.
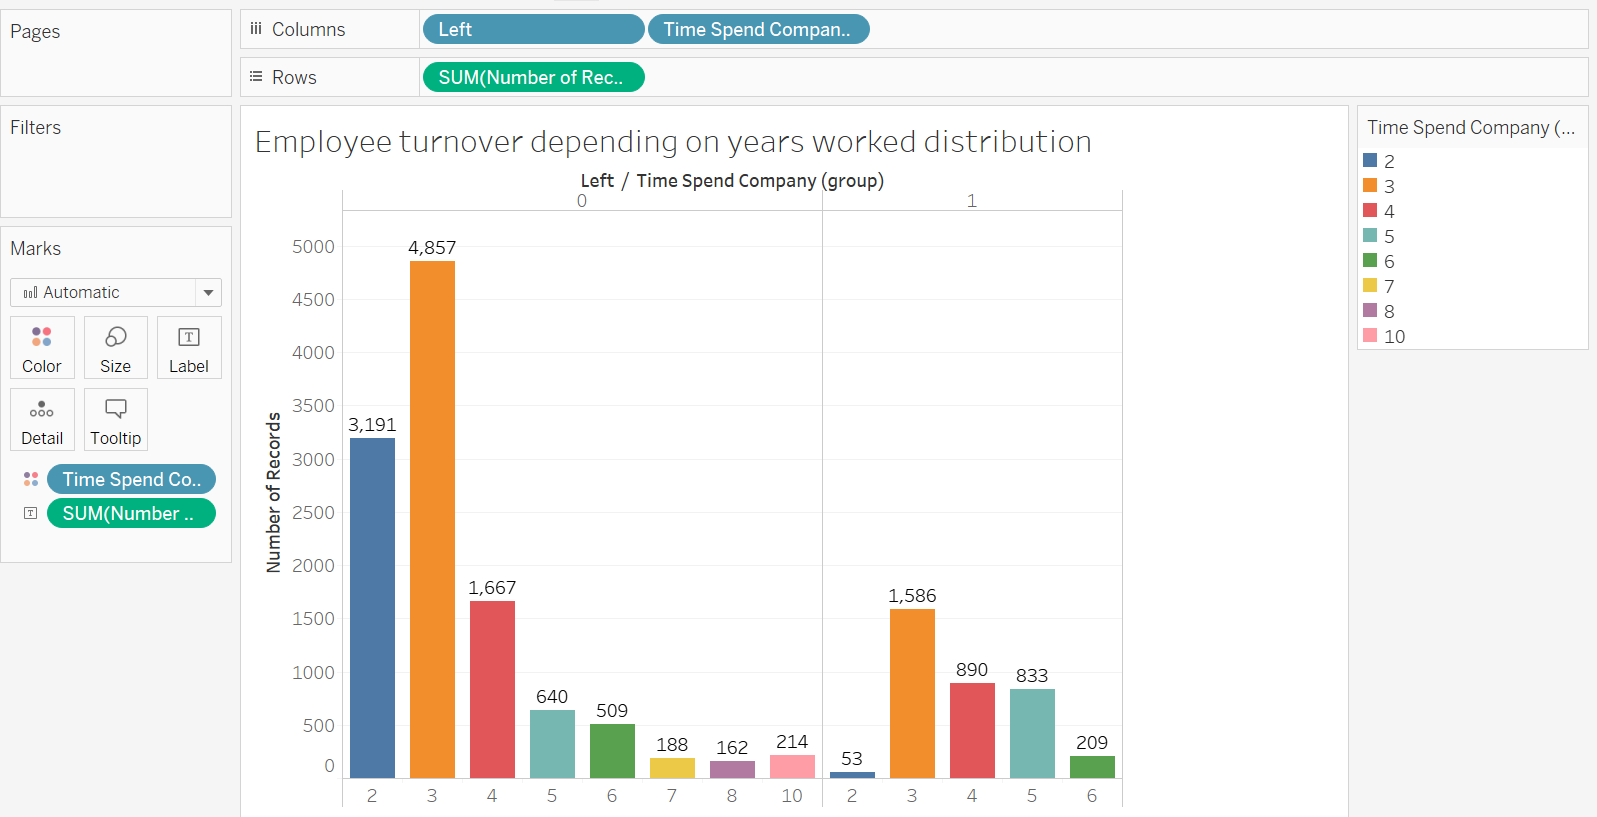
Procedure Followed:
- Dragged left and Time spend company measures into columns field.
- Drag number of records into rows field and select sum as measure.
- Drag Time spend company into marks and select type as color.
- Drag Number of records into Marks section and select sum as measure type to show number of records on the graph.
- Select horizontal bars as graph type and change its orientation to vertical.
Conclusion:
-
The first distribution of employee distribution shows us a somewhat normal distribution. Most of the companies employees have an average to above average satisfaction level which is a good sign. It is a bit alarming that we have 888 employees with a satisfaction rate of close to 0. This must be adressed in the future.
-
Next we were looking at the monthly hours clocked in by employees in a month. We can clearly observe that this is a binomial distribution graph. We have a mixed bag of employees that are either clocking in lower hours or clocking in higher hours.
-
Next we were looking at the department wise distribution of employees to see number of employees working in each department. We see that our sales department has maximum number of employees followed by the technical department.
-
Lastly we are looking at employee turnover. We can see that maximum number of employees have had between 2-4 years of experience. We can also observe that experienced employees are more likely to leave an organisation probably to look for more growth opportunities.
Project files:
Please find the project files here.
