An FDI case study
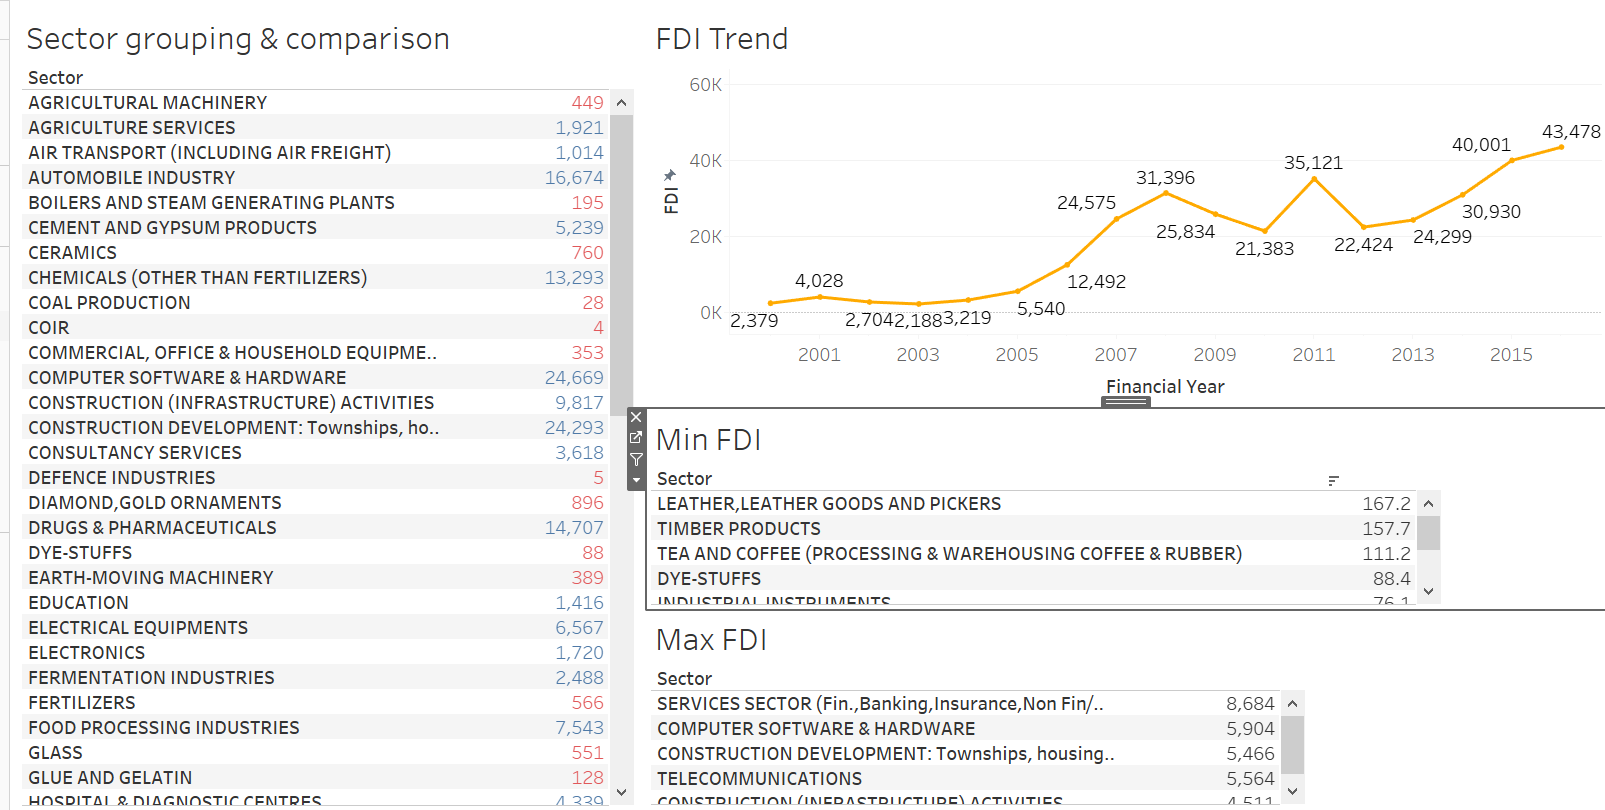
About the data:
The data consists of foreign investments of the last 17 years in Cr.
| Column | Measure/Dimension | Created |
|---|---|---|
| sector | Dimension | No |
| Pivot Field of year | Dimension | Yes |
| Financial Year | Dimension | Yes |
| FDI | Measure | No |
| SUM(FDI)<1000 | Measure | Yes |
Analyizing the data for:
- Max FDI
- Min FDI
- FDI Trend
- Sector Grouping & Comparision
Max FDI
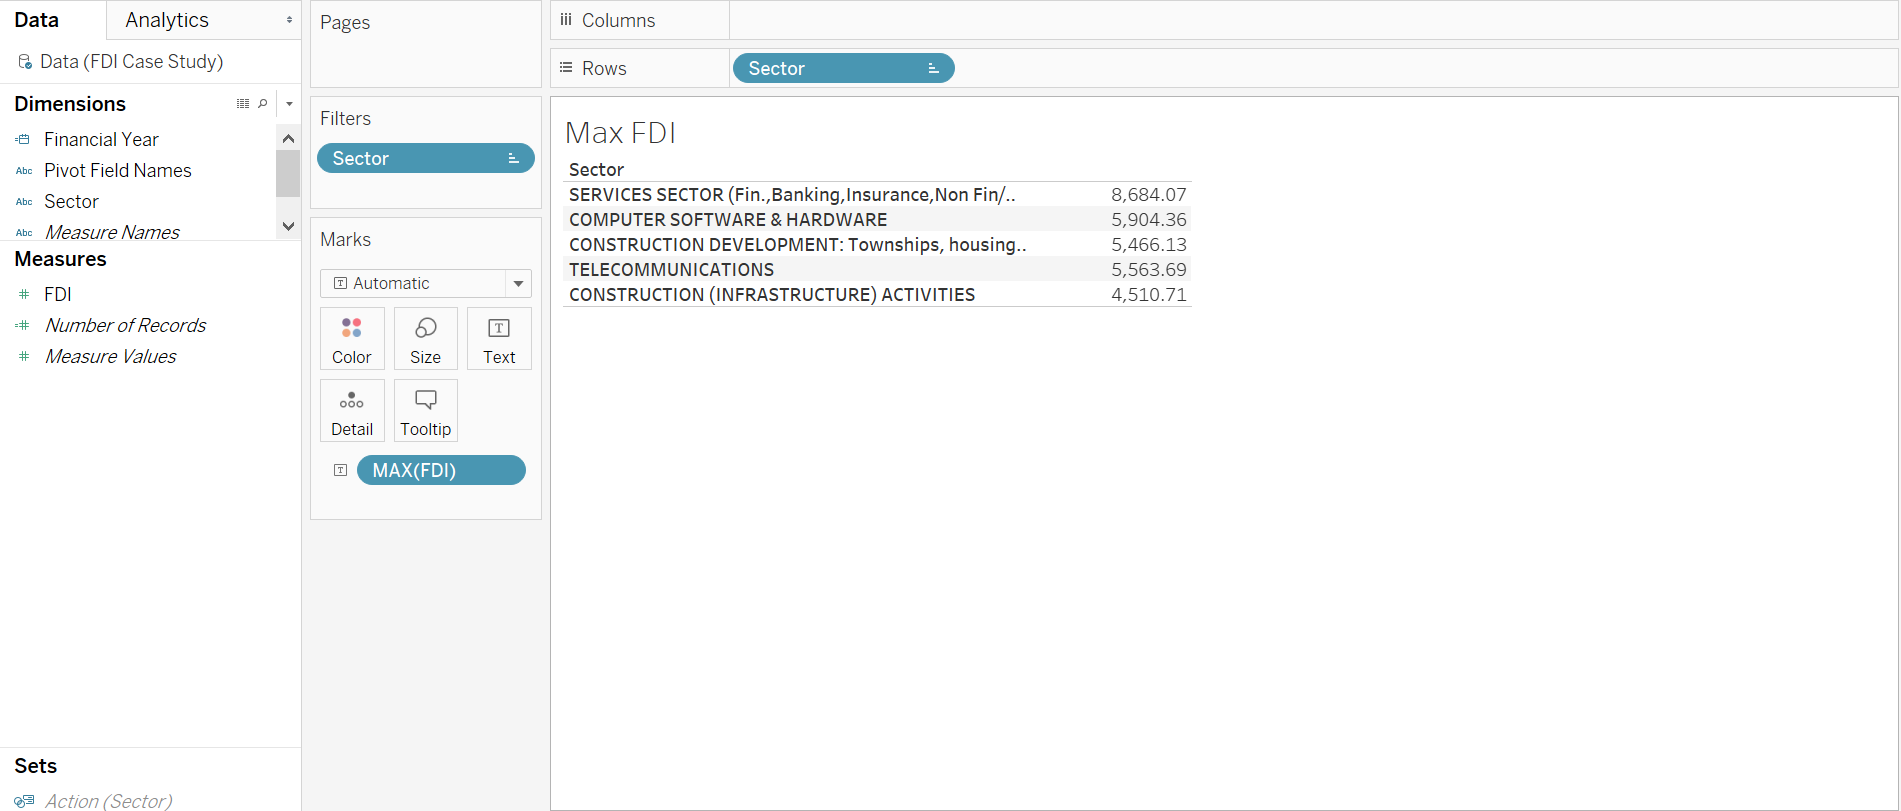
We are looking at the 5 sectors with the highest Foreign direct investment. This is the FDI for the top 5 sectors across the last 17 years. As can be seen in the image we see largeset FDI investment in:
Procedure followed:
- Dragged Sector into rows field.
- Used filter option to filter sector based on FDI using the top option within filters.
- Dragged FDI into marks and changed the measure to show maximum FDI.
- Changed the marker style to text to see the values in the table.
Min FDI
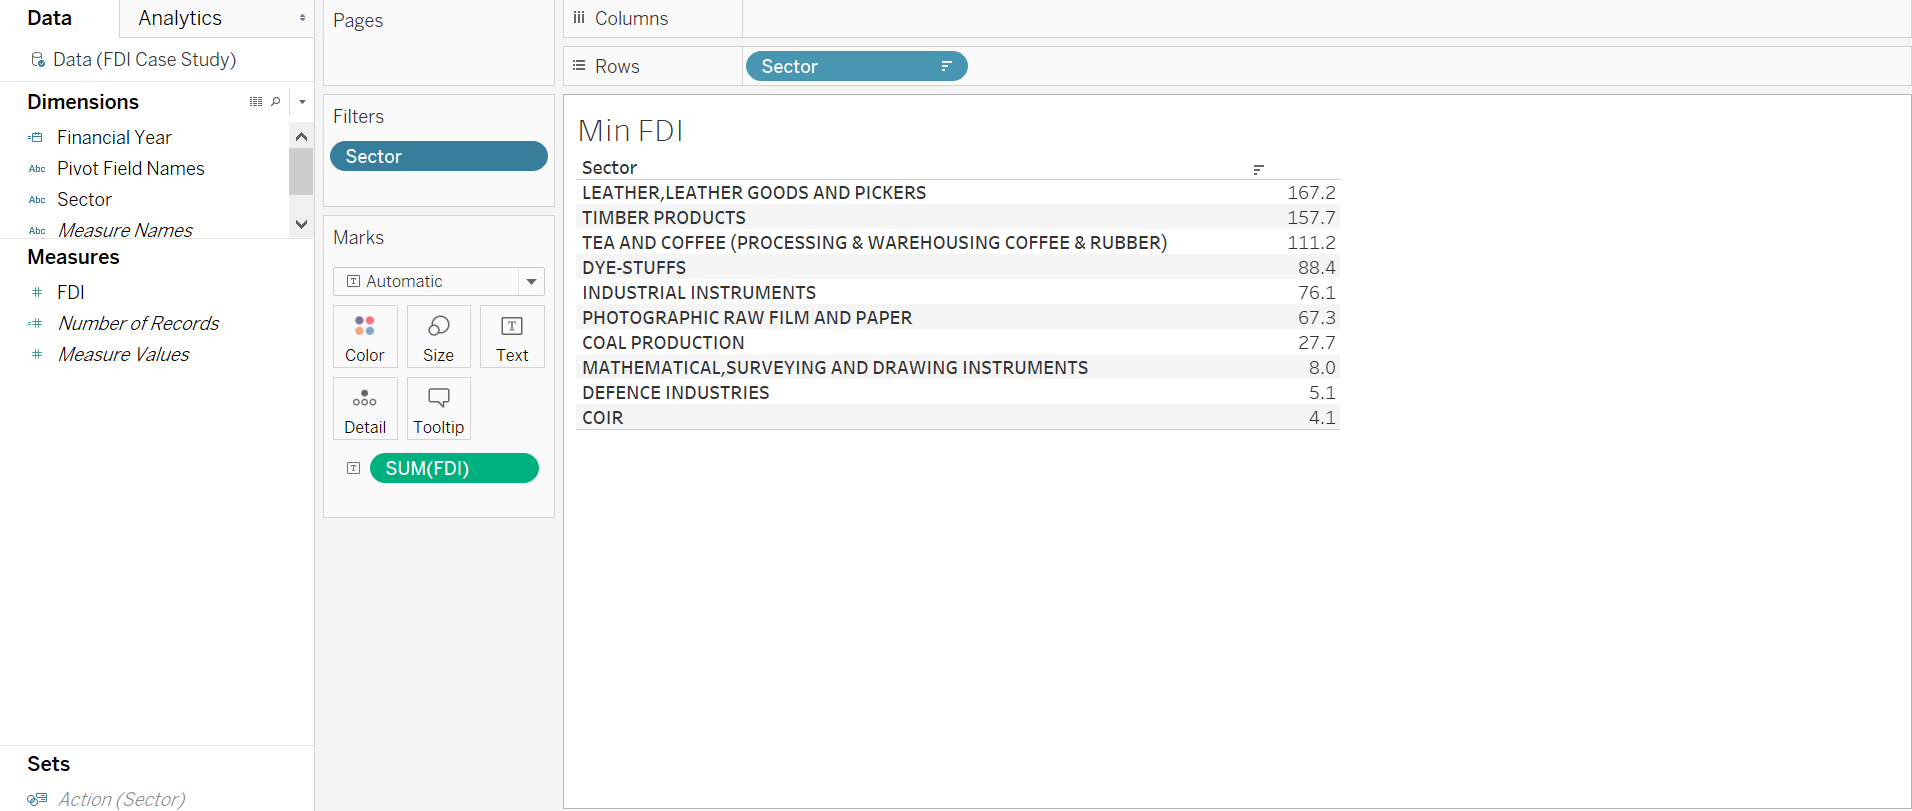
We are looking at 10 sectors that have had the lowet amount of FDI investment across 17 years. Here we are looking at the cummulative investment across 17 years. The 10 sectors with the lowest investment can be seen in the image.
Procedure Followed
- Dragged Sector into rows field.
- Used filter option to filter sector based on FDI using the bottom option within filters.
- Dragged FDI into marks and changed the measure to show sum of FDI.
- Changed the marker style to text to see the values in the table.
FDI Trend
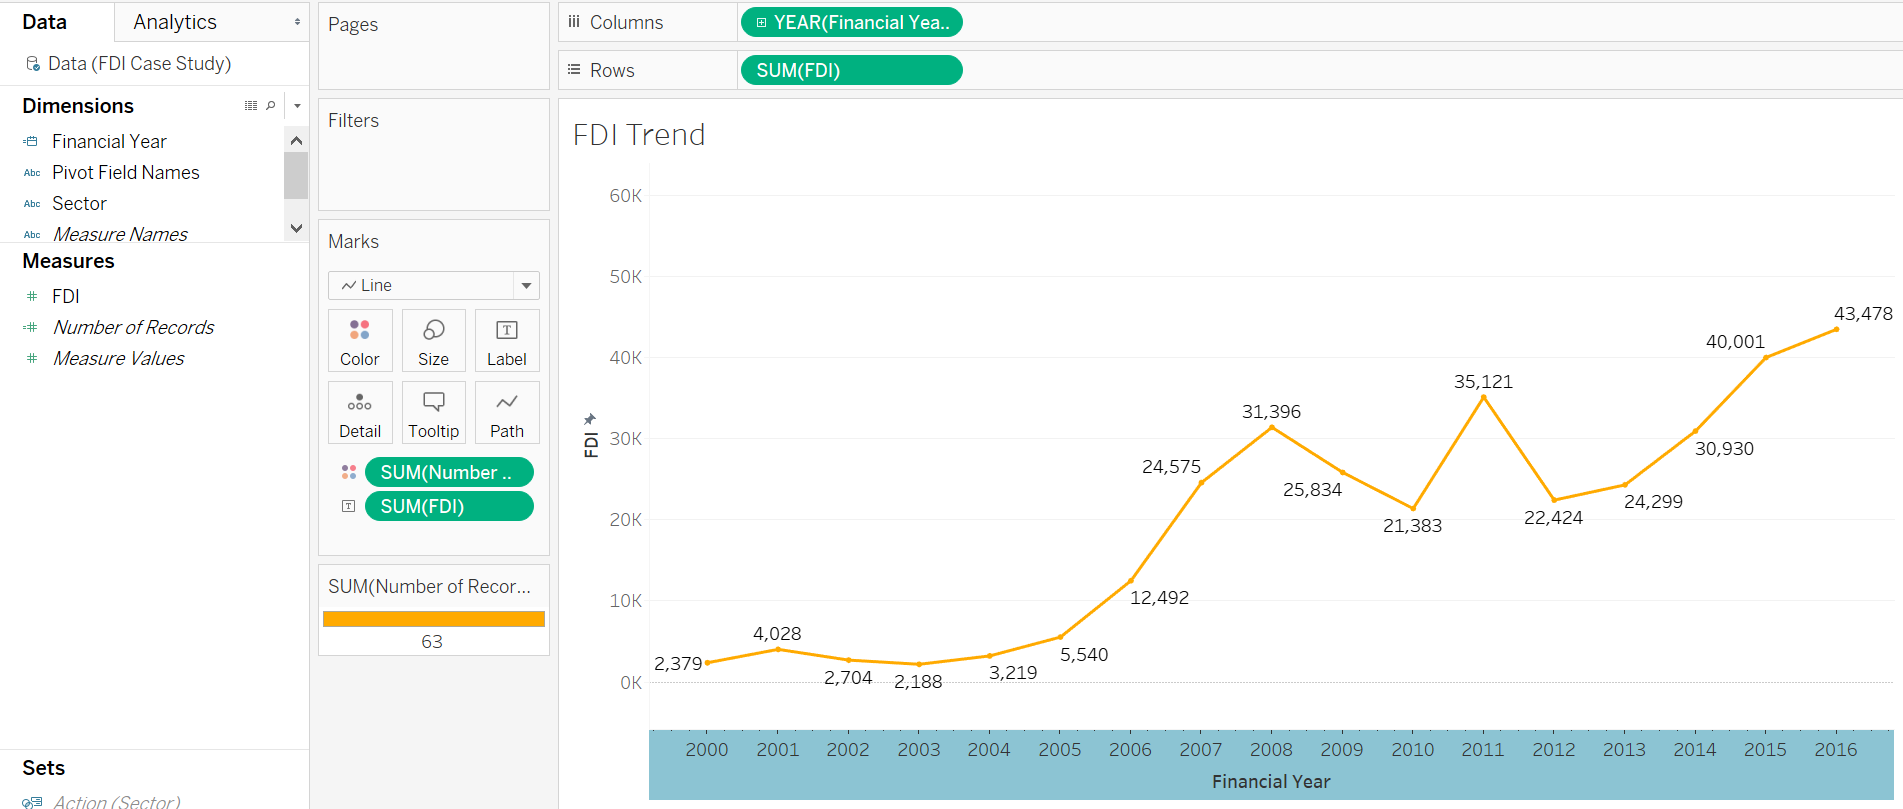
Here we are looking at the trend of FDI across 17 years and how it has increased over time. The graph gives us a good idea about how well the country and all its major sectors are doing.
Procedure followed
- Dragged Year into column field and selected year as option since Tableau gives an option for date time fields.
- Dragged FDI into marks and chose sum. Also changed its type to text to be visible on the graph.
- Add sum FDI in Rows field.
- Chose sum number of records for color although it is not required here.
- Chose path under marks as line.
Sector Grouping and Comparison.
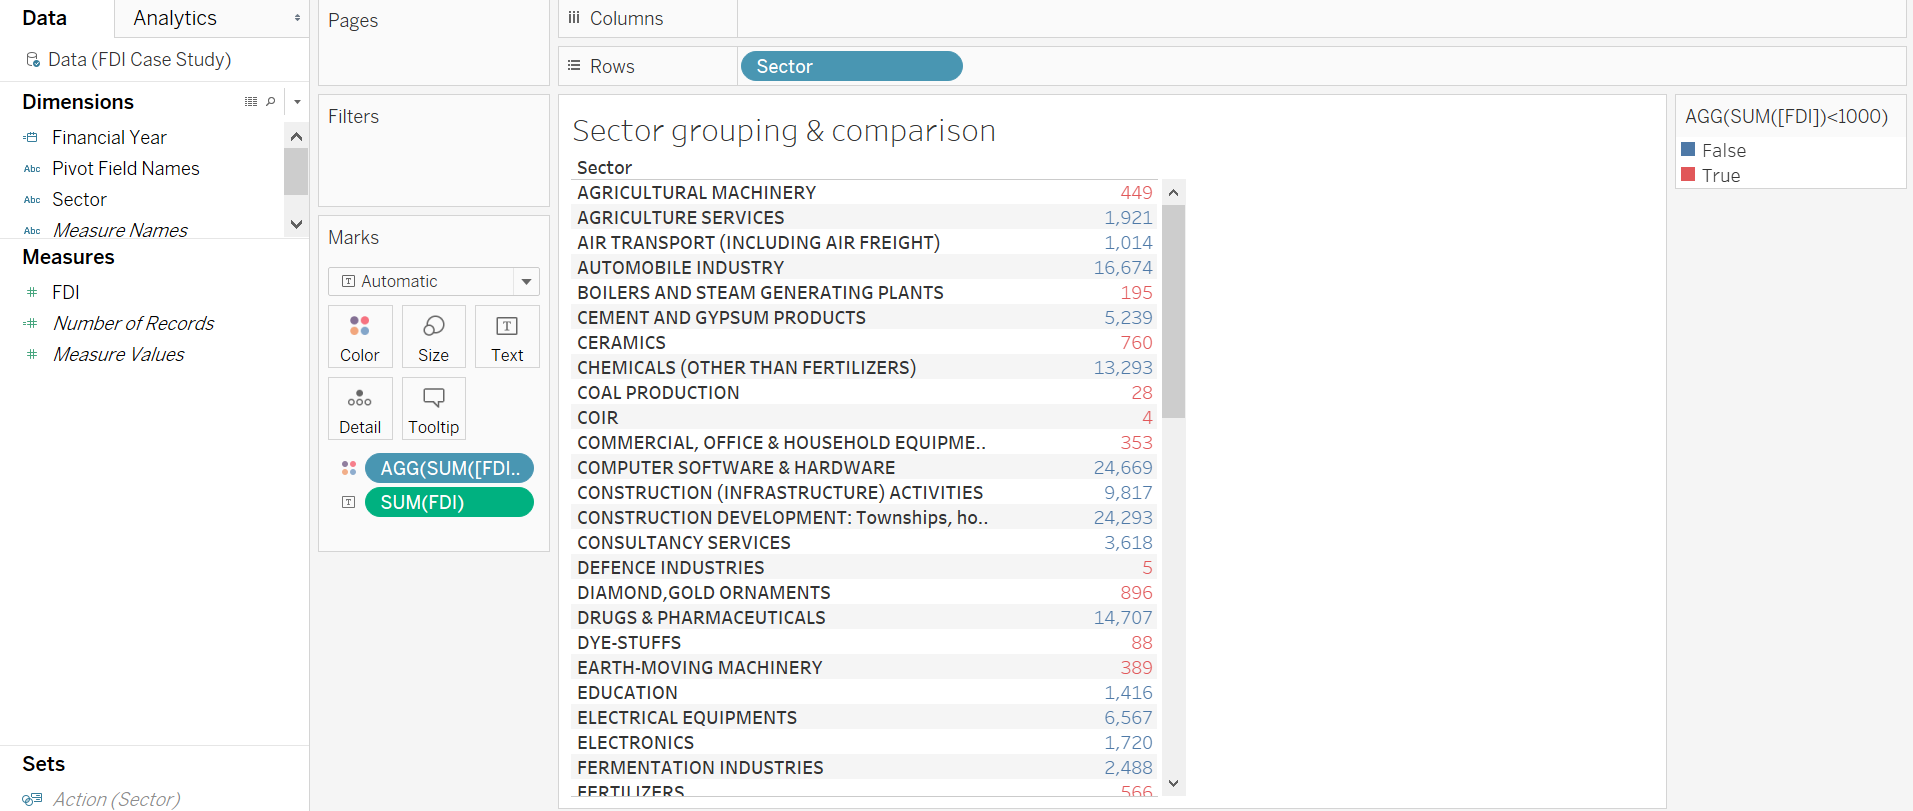
Here we are categorising our sectors into 2 categories. The red’s are the one’s that have not seen enough FDI over 17 years according to our set base line which is 1000. The blue values are sectors that have recieved FDI above our set baseline.
Procedure Followed
- Created a calculated field to set the baseline by passing SUM(FDI)<1000.
- Dragged FDI into marks and selected SUM.
- Dragged Sector into rows field.
Conclusions:
- There has been primarily FDI in Services, Computer, Telecom and Construction sector.
- There hasn’t been much FDI in Defense but that is primarily because of India’s rules of FDI where there was a limit of 49% for investing into the defense secotor. As of writing this post though the cap has been raised to 74% so there should be an increase in the future in this sector. Coal, coir and leather industry also don’t see much of investment from outside.
- The overall FDI trend is moving upward which is a good sign for the country.
Project Files:
Please find the project files here.
