Stock Market Articles Sentiment Analysis using NLP and MongoDB.
Index of this post
- Motivation
- Methodology followed
- Data Collection Strategy
- Webscrapping issues and challenges
- NLP Preprocessing
- Handling missing data
- Unsupervised Machine Learning
- Conclusion
Motivation to do this project
Recently I have taken an interest in investing and understanding the workings of the Indian Stock Market. From what I have learnt and understood, there are broadly two types of analysis we should do of a company before purchasing direct stocks.
- Fundamental Analysis
- Technical Analysis
Fundamental Analysis
This deals with the performance and future prospects of the company alone. It involves analyzing the overall company performance and future growth prospects. Under this type of analysis we would look at the companies cash flow statements, annual reports and their overall management.
Technical Analysis
This type of analysis purely deals with the performance of the stock in the market. We would analyze the different candle stick patterns, look for patterns like double bottom or the tea cup pattern etc. We also look at various metrics like the Stocks P/E Ratio, EPS, P/B Ratio, standard deviation, alpha which tells the performance of the stock vs the index and beta which gives us a picture of volatility and risk. There are many more parameters that must be looked at within technical analysis but as of now I have come accross only these metrics.
Overall Market News
After performing the above two analysis and picking your basket of stocks, it is also important to follow the news and understand about how these companies are performing. For this I have created a project which is scrapping news articles from the Economic Times to figure out overall news about the share market. Since I have started my investment journey through index funds I prefer to look at the overall market sentiment. This project does just that. It scouers through the articles and looks for key words which allow our algorithms to determine whether a news article is positive or negative. The implications of this could be used as a decision factor in whether to invest in the index at a certain time or not. For instance with high positive news, there is a chance that the index is doing very well on that day. Looking at previous articles we can see how the market did the following day and try to find patterns so that we can get an expectation of how the market performance the next day based on previous day market sentiments.
Methodology followed
Data Collection Strategy
-
From the website that I was collecting data, they had blocked access to libraries like urllib and url request. The only way to access the website was through a browser. So I decided to use the Selenium python library that would access the website via a browser and I could also code the entire scrapping process in python.
-
Using BeautifulSoup I have passed the output of selenium which is raw html into an html parser. This makes it easier to access each tag in the html which we will use to extract all the relevant data.
- I have collected 3 features:
- Date article was posted
- Article Headline
- Article Summary
-
Article URL
-
From the article url using requests, I am accessing each article page and scrapping data from each article.
-
Finally the data was stored on my local MongoDB database.
- I in no way encourage people to do webscrapping and understand that the hosts server faces the load. Hence I am safely scrapping 40-50 records every 2-3 days to ensure I am not bombarding the hosts system.
Webscrapping issues and challenges
-
The economic times loads more articles as we scroll which is why I could not use requests since it does not give us page movement features.
-
To load more news articles, the “load more articles” button is to be pressed and is located after all articles. For this I had to first center that button on the screen and then press the button. All of this was done in code.
-
Time taken to scrap close to 1440 articles was 45 mins.
-
Scrapped data was saved in a MongoDB database in my local system for future use.
NLP Preprocessing
Libraries Used
- NLTK Used this library to remove stop words and numbers.
-
String Used this library for removing punctuations.
-
NLP Preprocessing like converting articles to lowercase, replacing percentage, removing_punctuations, removing_stop_words and removing_numbers all took time to process since these are big articles over which we are applying all these transformations.
- Lemmatization was done for the words in articles to increase more words being common among the articles. The advantage of lemmatization is that it preserves the meaning of the word as opposed to stemming which would chop of words without looking at whether the obtained new word is part of the origin language or not.
Techniques tried but not used in model
- Chunking: Grouping words with similar POS tags into lists of lists.
- Name Entity Recognition: Recognizes any names mentioned in articles. Does not work very well with Indian names.
- POS Tagging: There are 8 parts of speech in the english language and using POS tagging we can attach a tag to each word.
- n-gram: Grouping n-words together.
Handling Missing Data
- Articles was the only column that had missing data. Since it was only 8%, I replaced the full article with the summary of the article which got captured.
Exploratory Data Analysis
- Visualization of the most frequently occuring words was done

TF-IDF
For converting the articles into number form, I manually converted the articles into numbers using the TF-IDF methodology. For better understanding I have written code for the same from scratch.
TF or Term Frequency calculates the probability of occurence of a word within a sentence or article.
IDF or Inverse Document Frequency would determine the actual importance of the word. It is the log of the total number of documents upon the number of documents that have the keyword.
Unsupervised Machine Learning
USL techniques used
- PCA (Principle Component Analysis)
- KMeans
- Agglomerative Clustering
PCA
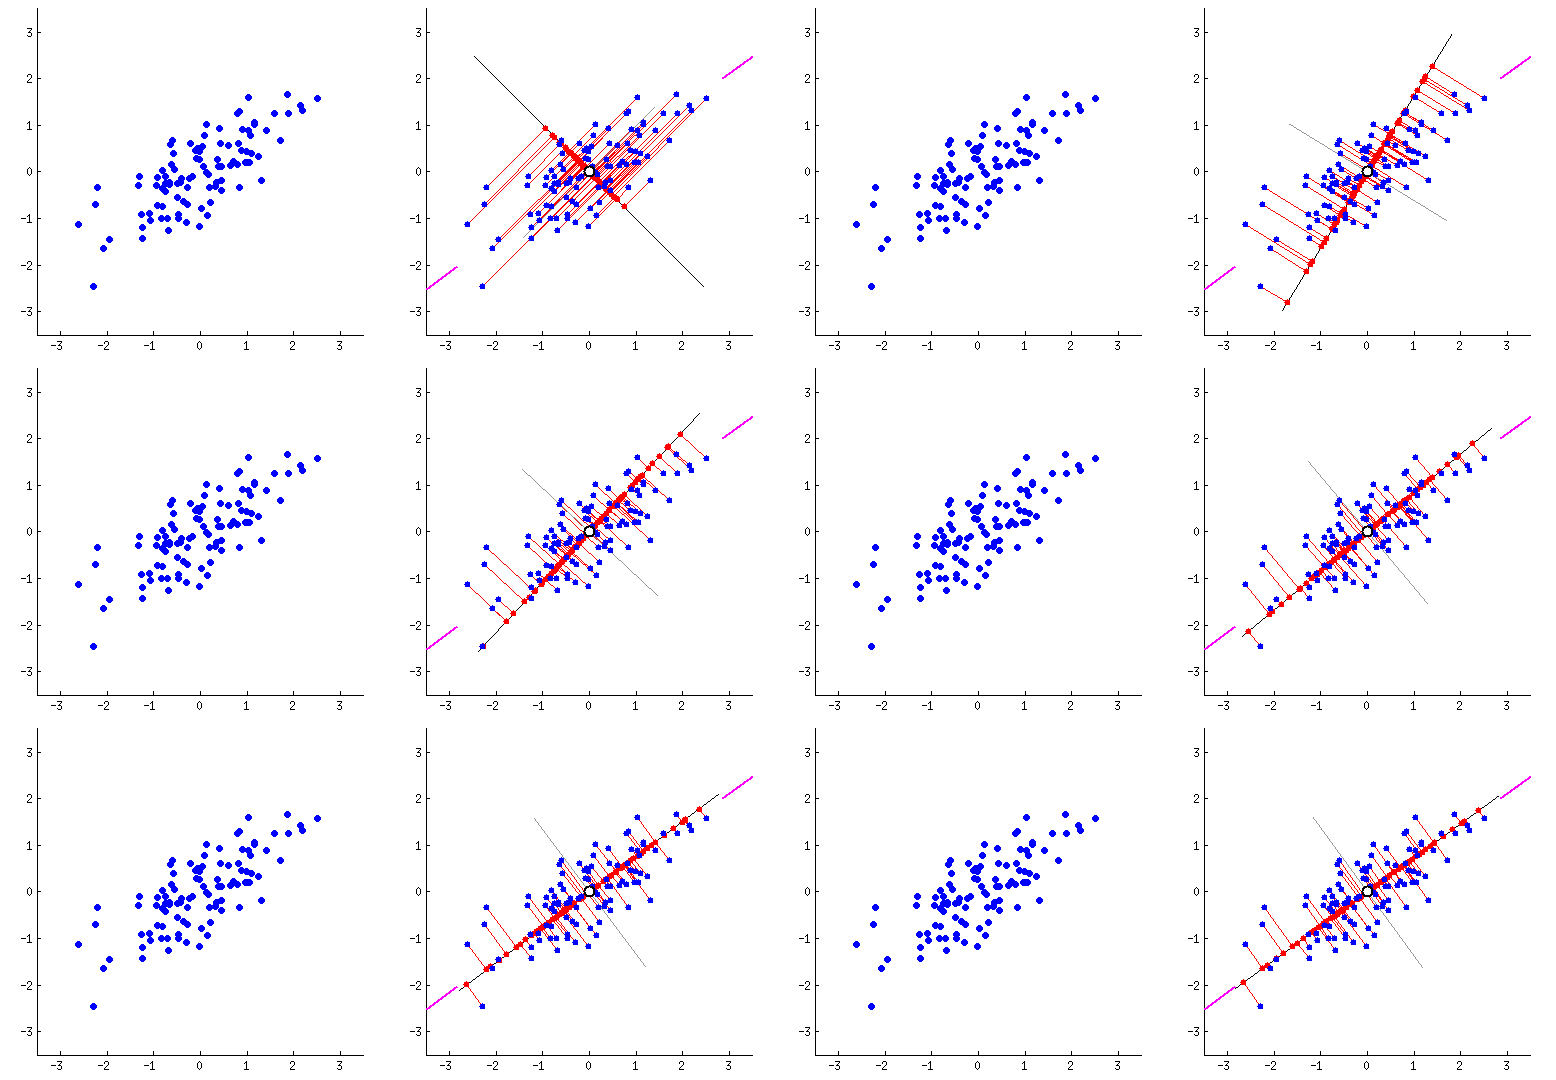
PCA is a dimensionality reduction technique which combines highly correlated features with each other by plotting the features on hyperplanes. This reduces the number of features present in the dataset. I am using PCA here since we are getting more than 40 features after applying TF-IDF on the articles. PCA would get rid of the extra dimensions while preserving 95% of overall variance in the dataset.
The variance is determined by using the explained variance ratio after applying PCA for the first time.
KMeans
WCV (within cluster variation) was used to figure out the number of appropriate clusters present in the dataset. Co-incidently we got 2 clusters present in the dataset which falls in line with determining whether an article is positive or negative.
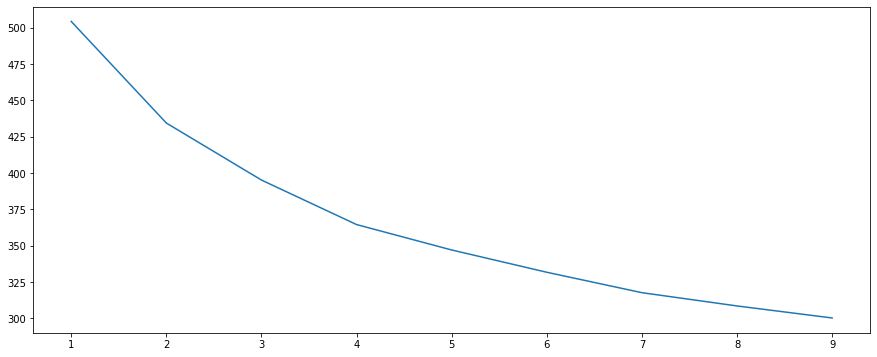
I created cclusters using 2 as the number of clusters and added it as a target feature to the TF-IDF dataset.
Agglomerative Clustering
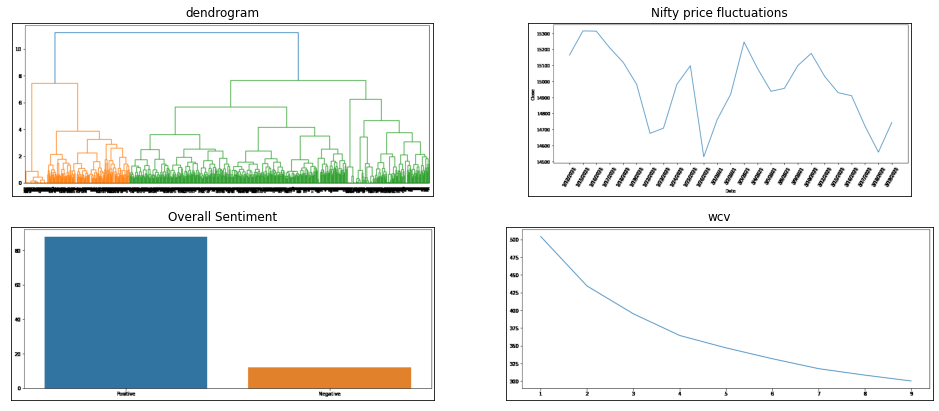
Since Agglomerative Clustering is a bottom up approach, we use the Dendrogram to figure out which are the optimum number of clusters as can be seen in the below image.

Labling the created clusters
I have relabled the obtained clusters as positive and negative by looking at the articles present within each class. The labels are positive for the positive article and negative for the negative articles.
Example of a positive article:
Example of a negative article:
Conclusion
We can look at the price fluctuations of nifty for the same time period as our dataset.
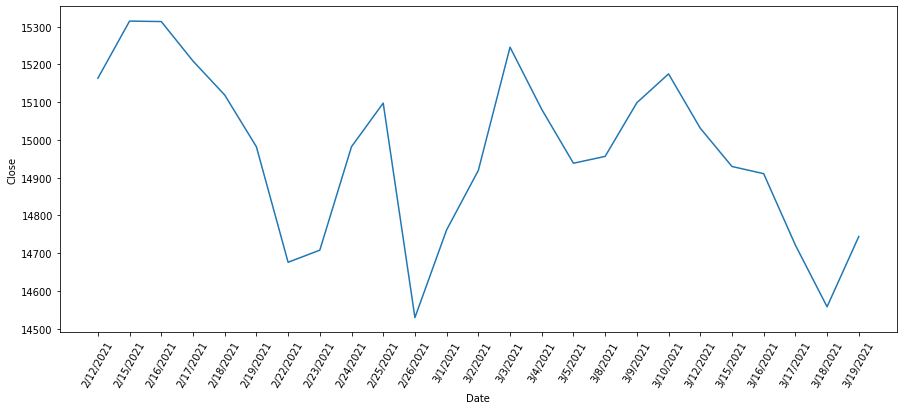
The above image is a graph of the nifty prices from Feb to March. We see extreme volatility in the price of nifty as is expected in the stock market. Another reason is that this price trend is occuring after a post-corona major bull run which the market had seen post the March 2020 market crash. Volatility is to be expected since investors are treding with caution during this time since Nifty was at its all time high during this time.
Sentiments we captured in our dataset
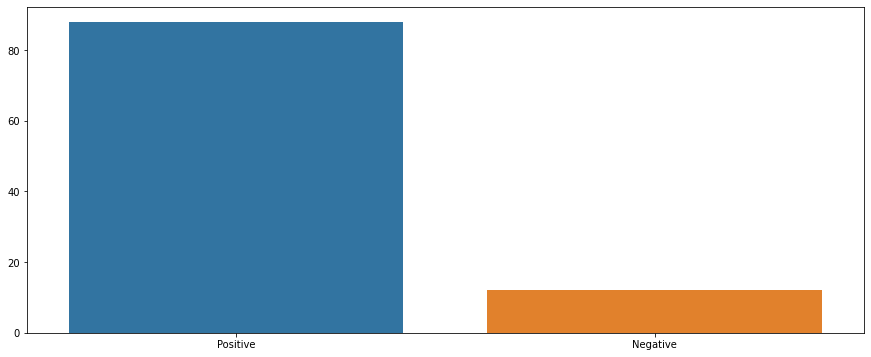
Our dataset however primarily shows positive articles with few negative articles as well. Positive news is to be expected during this time since the number of cases for COVID were going down and businesses were starting to generate more business during this time.
You can also check out this Project on github. Thank You for reading.
