Creating a growth story for a company's next round of funding using MySQL.
-
The Situation: Mavenfuzzyfactory’s CEO is close to securing its next round of funding and she needs our help to tell a compelling story to investors. We’ll need to pull the relevant data, and help her craft a story about a data-driven company that has been producing rapid growth.
-
The Objective: Extract and analyze website trafic and performance data to craft a growth story that your CEO can sell. Dive in to the marketing channel activities and the website improvements that have contributed to your success to date and use the opportunity to show the companies analytical skills to the investors.
-
As an analyst, the first part of your job is extracting and analyzing the data, and the next part of your job is effectively communicating the story to future investors.
-
(The dataset is from an online course that I had done on advanced SQL from maven analytics on udemy)
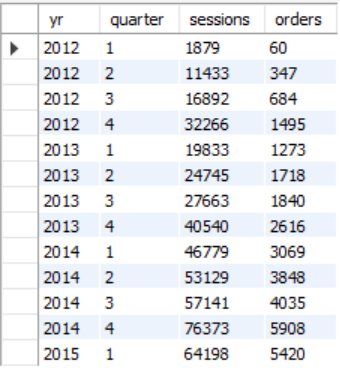
1. Pull overall session and order volume trended by quarter for the life of the business.
This is a very general metric to show that over the last 3 years the company has seen an increase in the number of sessions and number of orders. Positive times lie ahead for the company and the decision making process within the organisation seems to be working effectively.
Output:

SQL Code:
SELECT YEAR(s.created_at) AS yr,QUARTER(s.created_at) AS quarter, COUNT(DISTINCT s.website_session_id) AS sessions, COUNT(DISTINCT o.order_id) AS orders
FROM website_sessions s
LEFT JOIN orders o
ON o.website_session_id = s.website_session_id
GROUP BY 1,2;
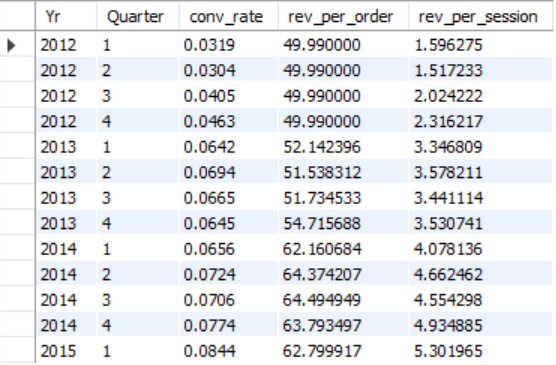
2. Show quarterly figures since launch for session to order conv rate, revenue per order, revenue per session.
Next we are looking at:
- The conversion rate: Sessions that were coverted to orders.
- Rev_per_order: The revenue per order which is showing us the average revenue per order.
- Rev_per_session: For total number of sessions how much revenue is the company generating.
All the metrics are increasing over time which means that the company is heading in the right direction.
Output:

SQL Code:
SELECT YEAR(s.created_at) AS Yr,
QUARTER(s.created_at) AS Quarter,
COUNT(DISTINCT o.order_id) / COUNT(DISTINCT s.website_session_id) AS conv_rate,
SUM(o.price_usd) / COUNT(DISTINCT o.order_id) AS rev_per_order,
SUM(o.price_usd) / COUNT(DISTINCT s.website_session_id) AS rev_per_session
FROM website_sessions s
LEFT JOIN orders o
ON o.website_session_id = s.website_session_id
GROUP BY 1,2;
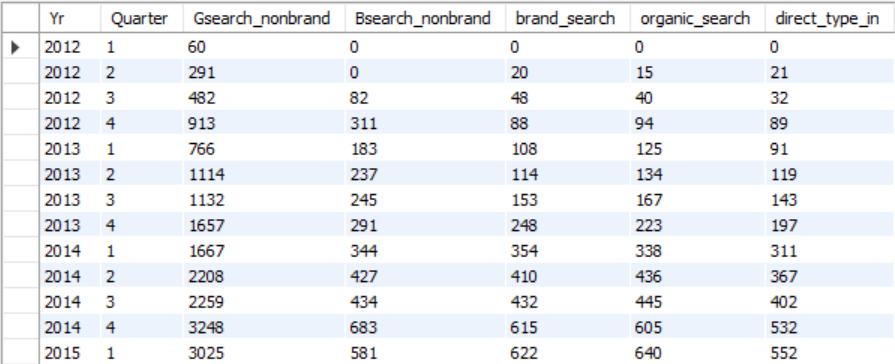
3. Growth of specific channels. Pull quarterly view of orders from Gsearch nonbrand, Bsearch nonbrand, brand search overall, organic search and direect type in.
We are seeing an increase in orders from each channel which means that over time the company has worked on generating orders from all their sources.
Output:

SQL Code:
SELECT YEAR(s.created_at) AS Yr,
QUARTER(s.created_at) AS Quarter,
COUNT(DISTINCT CASE WHEN s.utm_source = 'gsearch' AND s.utm_campaign = 'nonbrand' THEN o.order_id ELSE NULL END) AS Gsearch_nonbrand,
COUNT(DISTINCT CASE WHEN s.utm_source = 'Bsearch' AND s.utm_campaign = 'nonbrand' THEN o.order_id ELSE NULL END) AS Bsearch_nonbrand,
COUNT(DISTINCT CASE WHEN s.utm_campaign = 'brand' THEN o.order_id ELSE NULL END) AS brand_search,
COUNT(DISTINCT CASE WHEN s.utm_source IS NULL AND s.utm_campaign IS NULL AND s.http_referer IS NOT NULL THEN o.order_id ELSE NULL END) AS organic_search,
COUNT(DISTINCT CASE WHEN s.utm_source IS NULL AND s.utm_campaign IS NULL AND s.http_referer IS NULL THEN o.order_id ELSE NULL END) AS direct_type_in
FROM website_sessions s
LEFT JOIN orders o
ON o.website_session_id = s.website_session_id
GROUP BY 1,2;
4. Overall session to order conv rate trends for those with same channels by quarter.
Here we are seeing the conversion rate from each session source. This is an important metric that tells us which sources are working very well for us and which sources require more attention.
Output:

SQL Code:
SELECT YEAR(s.created_at) AS Yr,
QUARTER(s.created_at) AS Quarter,
COUNT(DISTINCT CASE WHEN s.utm_source = 'gsearch' AND s.utm_campaign = 'nonbrand' THEN o.order_id ELSE NULL END) / COUNT(DISTINCT CASE WHEN s.utm_source = 'gsearch' AND s.utm_campaign = 'nonbrand' THEN s.website_session_id ELSE NULL END) AS Gsearch_nonbrand_conv_rate,
COUNT(DISTINCT CASE WHEN s.utm_source = 'Bsearch' AND s.utm_campaign = 'nonbrand' THEN o.order_id ELSE NULL END) / COUNT(DISTINCT CASE WHEN s.utm_source = 'Bsearch' AND s.utm_campaign = 'nonbrand' THEN s.website_session_id ELSE NULL END) AS Bsearch_nonbrand_conv_rate,
COUNT(DISTINCT CASE WHEN s.utm_campaign = 'brand' THEN o.order_id ELSE NULL END) / COUNT(DISTINCT CASE WHEN s.utm_campaign = 'brand' THEN s.website_session_id ELSE NULL END) AS brand_search_conv_rate,
COUNT(DISTINCT CASE WHEN s.utm_source IS NULL AND s.utm_campaign IS NULL AND s.http_referer IS NOT NULL THEN o.order_id ELSE NULL END) / COUNT(DISTINCT CASE WHEN s.utm_source IS NULL AND s.utm_campaign IS NULL AND s.http_referer IS NOT NULL THEN s.website_session_id ELSE NULL END) AS organic_search_conv_rate,
COUNT(DISTINCT CASE WHEN s.utm_source IS NULL AND s.utm_campaign IS NULL AND s.http_referer IS NULL THEN o.order_id ELSE NULL END) / COUNT(DISTINCT CASE WHEN s.utm_source IS NULL AND s.utm_campaign IS NULL AND s.http_referer IS NULL THEN s.website_session_id ELSE NULL END) AS direct_type_in_conv_rate
FROM website_sessions s
LEFT JOIN orders o
ON o.website_session_id = s.website_session_id
GROUP BY 1,2;
5. Pull monthly trend for revenue and margin per product along with total sales and revenue.
The company has multiple products that were launched at different dates during the 3 years. Here we are seeing the performance by revenue and margin of each products. We can see which sessions are generating more revenue for the company. These insights could be used to make decisions about the next product that the company wants to develop.
Output:

SQL Code:
SELECT YEAR(created_at) AS yr,
MONTH(created_at) AS mon,
SUM(CASE WHEN product_id = 1 THEN price_usd ELSE NULL END) AS prod_1_revenue,
SUM(CASE WHEN product_id = 1 THEN price_usd ELSE NULL END) - SUM(CASE WHEN product_id = 1 THEN cogs_usd ELSE NULL END) AS prod_1_margin,
SUM(CASE WHEN product_id = 2 THEN price_usd ELSE NULL END) AS prod_2_revenue,
SUM(CASE WHEN product_id = 2 THEN price_usd ELSE NULL END) - SUM(CASE WHEN product_id = 2 THEN cogs_usd ELSE NULL END) AS prod_2_margin,
SUM(CASE WHEN product_id = 3 THEN price_usd ELSE NULL END) AS prod_3_revenue,
SUM(CASE WHEN product_id = 3 THEN price_usd ELSE NULL END) - SUM(CASE WHEN product_id = 3 THEN cogs_usd ELSE NULL END) AS prod_3_margin,
SUM(CASE WHEN product_id = 4 THEN price_usd ELSE NULL END) AS prod_4_revenue,
SUM(CASE WHEN product_id = 4 THEN price_usd ELSE NULL END) - SUM(CASE WHEN product_id = 4 THEN cogs_usd ELSE NULL END) AS prod_4_margin,
SUM(price_usd) AS Total_revenue,
SUM(price_usd) - SUM(cogs_usd) AS Total_margin
FROM order_items
GROUP BY
1,2;
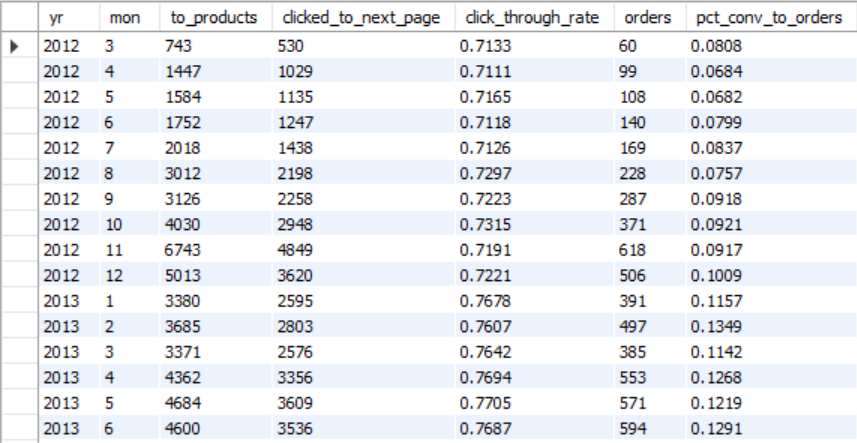
6. Monthly sessions to /products page. How many % of those sessions clicking through another page changed over time along with a view of how conv from /products to placing an order has improved.
Here we are seeing how many users are clicking on a product page which is represented by clicked_to_next_page letting us know that these many users went to the next page from the product page. Finally we have calculated the sessions from the product page getting converted into orders.
Output:

SQL Code:
CREATE TEMPORARY TABLE product_pageviews
SELECT website_session_id,
website_pageview_id,
created_at AS created_at
FROM website_pageviews
WHERE pageview_url = '/products';

SELECT YEAR(p.created_at) AS yr,
MONTH(p.created_at) AS mon,
-- Pull monthly sessions to the products page
COUNT(DISTINCT p.website_session_id) AS to_products,
COUNT(DISTINCT wp.website_session_id) AS clicked_to_next_page,
COUNT(DISTINCT wp.website_session_id) / COUNT(DISTINCT p.website_session_id) AS click_through_rate,
COUNT(DISTINCT o.order_id) AS orders,
COUNT(DISTINCT o.order_id) / COUNT(DISTINCT p.website_session_id) AS pct_conv_to_orders
FROM product_pageviews p
LEFT JOIN website_pageviews wp
ON wp.website_session_id = p.website_session_id
AND wp.website_pageview_id > p.website_pageview_id
LEFT JOIN orders o
ON o.website_session_id = p.website_session_id
GROUP BY 1,2;
7. Pull sales data since 4th Dec 2014 when product 4 was launched and show how well each prooduct cross sells from one another.
We are trying to see which products sold with another product here. This is the concept of cross selling where one website session went on to buy multiple products from the website. This information allows us to front such products together on the product page increasing the chances of a cross sell in the future. Or during checkout we could recommend the other product that has been bought regularly with the said product. eg. We see this regularly on Amazon with phone accessories.
Output:

SQL Code:
CREATE TEMPORARY TABLE after_4th_prod
SELECT *
FROM orders
WHERE created_at > '2014-12-05';

CREATE TEMPORARY TABLE Cross_sell_data
SELECT p.*,
i.product_id AS cross_sell_prod
FROM after_4th_prod p
LEFT JOIN order_items i
ON p.order_id = i.order_id
AND i.is_primary_item = 0;

SELECT primary_product_id,
COUNT(DISTINCT order_id) AS Total_orders,
COUNT(DISTINCT CASE WHEN cross_sell_prod = 1 THEN order_id ELSE NULL END) AS x_sold_p1,
COUNT(DISTINCT CASE WHEN cross_sell_prod = 2 THEN order_id ELSE NULL END) AS x_sold_p2,
COUNT(DISTINCT CASE WHEN cross_sell_prod = 3 THEN order_id ELSE NULL END) AS x_sold_p3,
COUNT(DISTINCT CASE WHEN cross_sell_prod = 4 THEN order_id ELSE NULL END) AS x_sold_p4,
 COUNT(DISTINCT CASE WHEN cross_sell_prod = 1 THEN order_id ELSE NULL END) / COUNT(DISTINCT order_id) AS p1_xsell_rt,
 COUNT(DISTINCT CASE WHEN cross_sell_prod = 2 THEN order_id ELSE NULL END) / COUNT(DISTINCT order_id) AS p2_xsell_rt,
 COUNT(DISTINCT CASE WHEN cross_sell_prod = 3 THEN order_id ELSE NULL END) / COUNT(DISTINCT order_id) AS p3_xsell_rt,
 COUNT(DISTINCT CASE WHEN cross_sell_prod = 4 THEN order_id ELSE NULL END) / COUNT(DISTINCT order_id) AS p4_xsell_rt
FROM cross_sell_data
GROUP BY primary_product_id
My Recomendations:
- Website has received most traffic in the 4th quarter since the start. We can invest more into advertising for the first quarter to drive more traffic during these times
- Revenue is directly linked to the number of sessions occuring in each quarter. If we are able to pull more traffic our revenue will go up.
- Our brand value has also gone up as we can see that brand_search has increased over time which is good. 4.Bsearch nonbrand isnt getting us as much traffic as gsearch. We must look into how much of our budget is being allocated to bsearch and invest more in gsearch.
- Conversion rate has improved on the products page since the experiment that was conducted earlier.
- The number of sessions to the products page has started to plateau. We can see a similar trend in previous years.
