Analyzing website traffic data to show overall company growth using MySQL.
-
The Situation: Mavenfuzzyfactory has been live for 8 months and the CEO is due to present company performance metrics to the board next week. I have been tasked to prepare relevant metrics to show the company’s promising growth.
-
The Objective: Extract and analyze website trafic and performance data from the Mavenfuzzyfactory database to quantify the company’s growth, and to tell the story of how data analytics has enabled growth.
-
(The dataset is from an online course that I had done on advanced SQL from maven analytics on udemy)
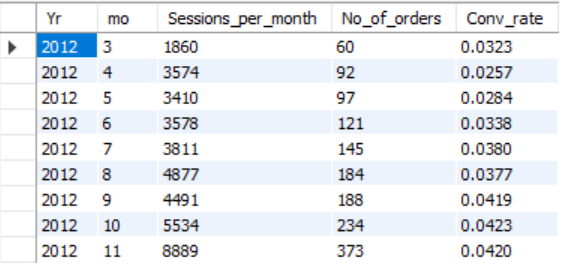
1. Gsearch (Paid traffic source) is the biggest driver of our business, pull monthly trends for gsearch sessions and orders so that we can showcase growth there.
| Output |
 |
| Overtime we can see an increase in website traffic which is a positive for a website that has been live for just 8 months at this stage. |
SQL Code:
SELECT
YEAR(ws.created_at) AS Yr,
MONTH(ws.created_at) AS mo,
COUNT(DISTINCT ws.website_session_id) AS Sessions_per_month,
COUNT(o.items_purchased) AS No_of_orders,
COUNT(o.items_purchased)/COUNT(DISTINCT ws.website_session_id) AS Conv_rate
FROM website_sessions ws
LEFT JOIN Orders o
ON ws.website_session_id = o.website_session_id
WHERE ws.utm_source = "gsearch"
AND ws.created_at < "2012-11-27"
GROUP BY
1,2;
2. Do same analysis but this time compare brand and non-brand to see if there has been an impact because of the brand.
| Output |
 |
| The non-brand sessions are paid sessions that come through ads that the company had deployed. The positive is that we can see even some brand sessions which are organic sessions which is a big positive. |
SQL Code:
SELECT YEAR(ws.created_at) AS Yr,
MONTH(ws.created_at) AS Mo,
COUNT(DISTINCT CASE WHEN ws.utm_campaign = "nonbrand" THEN ws.website_session_id ELSE NULL END) AS Non_Brand_campaign_sessions,
COUNT(DISTINCT CASE WHEN ws.utm_campaign = "nonbrand" THEN o.order_id ELSE NULL END) AS Non_Brand_Orders,
COUNT(DISTINCT CASE WHEN ws.utm_campaign = "brand" THEN ws.website_session_id ELSE NULL END) AS Brand_campaign_sessions,
COUNT(DISTINCT CASE WHEN ws.utm_campaign = "brand" THEN o.order_id ELSE NULL END) AS Brand_Orders
FROM website_sessions ws
LEFT JOIN Orders o
ON ws.website_session_id = o.website_session_id
WHERE ws.utm_source = "gsearch"
AND ws.created_at < "2012-11-27"
AND ws.utm_campaign IN ('nonbrand', 'brand')
GROUP BY
1,2;
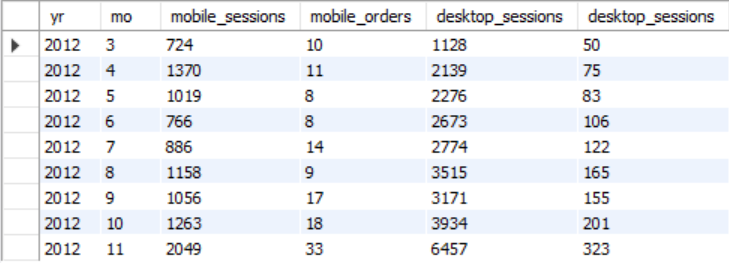
3. Pull monthly sessions and orders split by device type.
| Output |
 |
| We are trying to see what devices are our customers using. Here we can see that there are much more desktop sessions than mobile sessions. This is normal but we can maybe improve the UI of the website to make it more mobile friendly to increase traffic from mobile devices as well. |
SQL Code:
SELECT YEAR(ws.created_at) AS yr,
MONTH(ws.created_at) AS mo,
COUNT(DISTINCT CASE WHEN ws.device_type = "mobile" THEN ws.website_session_id ELSE NULL END) AS mobile_sessions,
COUNT(DISTINCT CASE WHEN ws.device_type = "mobile" THEN o.order_id ELSE NULL END) AS mobile_orders,
COUNT(DISTINCT CASE WHEN ws.device_type = "desktop" THEN ws.website_session_id ELSE NULL END) AS desktop_sessions,
COUNT(DISTINCT CASE WHEN ws.device_type = "desktop" THEN o.order_id ELSE NULL END) AS desktop_sessions
FROM website_sessions ws
LEFT JOIN Orders o
ON o.website_session_id = ws.website_session_id
WHERE ws.created_at < "2012-11-27"
AND ws.utm_campaign = "nonbrand"
AND ws.utm_source = "gsearch"
GROUP BY
1,2;
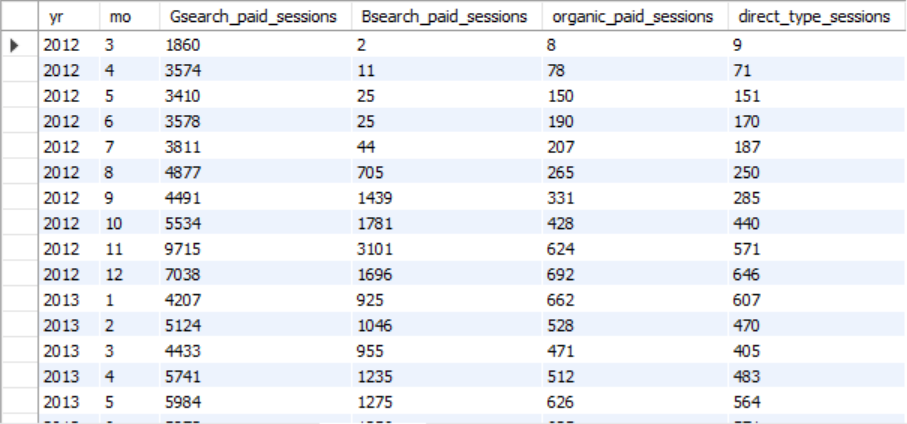
4. Monthly session and order trends for each session source.
| Output |
 |
| There are different sources from where we are receiving traffic online. We have cummulated them into 4 groups and tried to analyze which sources are doing well for us and which sources can be improved upon or focused upon. |
SQL Code:
SELECT YEAR(created_at) AS yr,
MONTH(created_at) AS mo,
COUNT(DISTINCT CASE WHEN utm_source = "gsearch" THEN website_session_id ELSE NULL END) AS Gsearch_paid_sessions,
COUNT(DISTINCT CASE WHEN utm_source = "Bsearch" THEN website_session_id ELSE NULL END) AS Bsearch_paid_sessions,
COUNT(DISTINCT CASE WHEN utm_source IS NULL AND  http_referer IS NOT NULL THEN website_session_id ELSE NULL END) AS organic_paid_sessions,
COUNT(DISTINCT CASE WHEN utm_source IS NULL AND  http_referer IS NULL THEN website_session_id ELSE NULL END) AS direct_type_sessions
FROM website_sessions ws
GROUP BY
1,2;
| Output |
 |
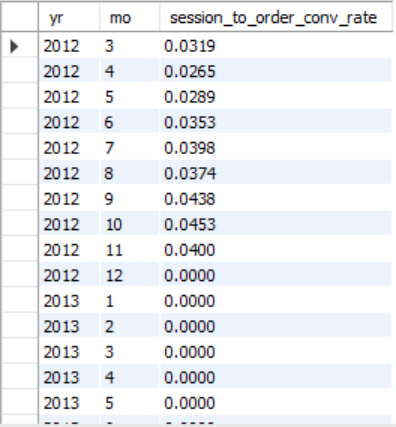
| The session to order conversion rate is a key indicator of how the website is performing in terms of generating revenue. This is a key metric and must be focused upon. It is not surprising that the conversion rate has gone up. There is a high correlation between the number of sessions and number of orders placed in our database. |
SQL Code:
SELECT YEAR(ws.created_at) AS yr,
MONTH(ws.created_at) AS mo,
COUNT(DISTINCT o.order_id)/COUNT(DISTINCT ws.website_session_id) AS session_to_order_conv_rate
FROM website_sessions ws
LEFT JOIN orders o
ON o.website_session_id = ws.website_session_id
AND ws.created_at < "2012-11-27"
AND YEAR(ws.created_at) <= 2012
GROUP BY
1,2;
6. For gsearch lander test, estimate revenue that test earned us (Hint: Look at increased CVR from jun 19 - jul 28, and use non brand sessions and revenue since then to calculate incremental value).
The company had developed a lander page and had conducted an experiment with the page which drove more traffic towards that page. We are trying to compare the performance of the two pages since the inception of lander 1 page.
| Output |
Conclusion |
 |
First we find the min page view for the lander page to know when was the page viewed first. This will allow us to get the gsearch sessions from this id so that we have a fair comparison. |
 |
The latest session here is of gsearch that will give us the end point for the test. |
 |
Sessions_since_the_test will give us the total number of sessions since the test. |
 |
The experiment has worked since we see an increase in all fields of the lander page. |
SQL Code:
SELECT MIN(website_pageview_id) AS first_time_page_was_viewed
FROM website_pageviews
WHERE pageview_url = "/lander-1";
-- 23504

CREATE TEMPORARY TABLE first_page_viewed
SELECT wp.website_session_id, MIN(wp.website_pageview_id) AS min_page_viewed
FROM website_pageviews wp
INNER JOIN website_sessions ws
ON ws.website_session_id = wp.website_session_id
AND ws.created_at < "2012-07-28"
AND wp.website_pageview_id >= 23504
AND ws.utm_source = "gsearch"
AND ws.utm_campaign = "nonbrand"
GROUP BY
wp.website_session_id;

-- GET THE URL
CREATE TEMPORARY TABLE session_w_landing_page
SELECT f.website_session_id, w.pageview_url AS landing_page
FROM first_page_viewed f
LEFT JOIN website_pageviews w
ON f.website_session_id = w.website_session_id
WHERE w.pageview_url IN ('/home', '/lander-1');

-- Bring in orders
CREATE TEMPORARY TABLE session_w_landing_page_and_orders
SELECT s.website_session_id, s.landing_page, o.order_id AS order_id
FROM session_w_landing_page s
LEFT JOIN orders o
ON o.website_session_id = s.website_session_id;

SELECT  landing_page,
		COUNT(DISTINCT website_session_id) AS sessions,
		COUNT(DISTINCT order_id) AS Orders,
        COUNT(DISTINCT order_id)/COUNT(DISTINCT website_session_id) AS Conv_rate
FROM session_w_landing_page_and_orders
GROUP BY
landing_page;

-- Find latest gsearch website_session_id

SELECT MAX(ws.website_session_id) AS Latest_session
FROM website_pageviews wp
INNER JOIN website_sessions ws
ON ws.website_session_id = wp.website_session_id
AND wp.pageview_url = "/home"
AND ws.utm_source = "gsearch"
AND ws.utm_campaign = "nonbrand";

-- 17145 is the max session

-- Count no. of sessions since the test

SELECT COUNT(website_session_id) AS sessions_since_test
FROM website_sessions
WHERE created_at < "2012-11-27"
AND website_session_id > 17145
AND utm_source = "gsearch"
AND utm_campaign = "nonbrand";

-- 22972 sessions since test

-- 22972 * (convrate of /home - convrate of /lander) = 22972 * 0.0087 = 200 orders up
-- Conclusion is that orders were up by 200 since 7/28
-- Roughly 50 extra orders per month
7. For the landing page test done previously, show a full conversion funnel from each of the two pages to orders. Time period Jun 19 to Jul 28.
| Output |
 |
| This query allows us to know how many sessions are going to each page and are coming from which page. Mostly both home and lander are showing similar performance. Looking at this output I would say implementing the changes made to the landing page to the home page should ideally give us an increase in number of sesisons from the home page. |
SQL Code:
CREATE TEMPORARY TABLE pages_each_session_made
SELECT
website_session_id,
pageview_url,
MAX(products_page) AS products_made_it,
MAX(mrfuzzy_page) AS mrfuzzy_made_it,
MAX(cart_page) AS cart_made_it,
MAX(billing_page) AS billing_made_it,
MAX(shipping_page) AS shipping_made_it,
MAX(thankyou_page) AS thankyou_made_it
FROM
(
SELECT s.website_session_id,
p.pageview_url,
CASE WHEN p.pageview_url = "/home" THEN 1 ELSE 0 END AS home_page,
CASE WHEN p.pageview_url = "/lander-1" THEN 1 ELSE 0 END AS lander_page,
CASE WHEN p.pageview_url = "/products" THEN 1 ELSE 0 END AS products_page,
CASE WHEN p.pageview_url = '/the-original-mr-fuzzy' THEN 1 ELSE 0 END AS mrfuzzy_page,
CASE WHEN p.pageview_url = "/cart" THEN 1 ELSE 0 END AS Cart_page,
CASE WHEN p.pageview_url = "/billing" THEN 1 ELSE 0 END AS billing_page,
CASE WHEN p.pageview_url = "/shipping" THEN 1 ELSE 0 END AS shipping_page,
CASE WHEN p.pageview_url = '/thank-you-for-your-order' THEN 1 ELSE 0 END AS thankyou_page
FROM website_pageviews p
INNER JOIN website_sessions s
ON p.website_session_id = s.website_session_id
WHERE s.created_at < "2012-07-28"
AND s.website_session_id >= 11681
AND s.utm_source = "gsearch"
AND s.utm_campaign = "nonbrand"
ORDER BY
s.website_session_id
) AS pages_each_session_made
GROUP BY
website_session_id;

-- Getting all the required metrics
SELECT  pageview_url,
		COUNT(DISTINCT website_session_id) AS Total_sessions,
		COUNT(DISTINCT CASE WHEN products_made_it = 1 THEN website_session_id ELSE NULL END) AS Product_sessions,
		COUNT(DISTINCT CASE WHEN mrfuzzy_made_it = 1 THEN website_session_id ELSE NULL END) AS mrfuzzy_sessions,
        COUNT(DISTINCT CASE WHEN cart_made_it = 1 THEN website_session_id ELSE NULL END) AS cart_sessions,
        COUNT(DISTINCT CASE WHEN billing_made_it = 1 THEN website_session_id ELSE NULL END) AS billing_sessions,
        COUNT(DISTINCT CASE WHEN shipping_made_it = 1 THEN website_session_id ELSE NULL END) AS shipping_sessions,
        COUNT(DISTINCT CASE WHEN thankyou_made_it = 1 THEN website_session_id ELSE NULL END) AS thankyou_sessions
FROM pages_each_session_made
GROUP BY
pageview_url;
8. Quantify the impact of billing test as well. Analyze lift generated form the test (Sep 10 - Nov 10) in terms of revenue per billing session and pull no. of billing page sessions for the past month to understand monthly impact.
| Output |
Output |
 |
 |
Similar to the home and lander comparison a similar activity was inititated for 2 billing pages. As can be seen from the results we have seen an increase in order rate from the new billing page. We have also shown the increase in value that the new billing page was responsible for. These results show that the company is moving towards the right direction and are on a growth path.
SQL Code:
USE mavenfuzzyfactory;
SELECT p.pageview_url, COUNT(DISTINCT p.website_session_id) AS Sessions,
COUNT(DISTINCT o.order_id) AS Number_of_orders,
SUM(o.price_usd)/ COUNT(DISTINCT p.website_session_id) AS per_sesison_order_rate
FROM website_pageviews p
LEFT JOIN
orders o
ON p.website_session_id = o.website_session_id
WHERE p.pageview_url IN ('/billing', '/billing-2')
AND p.created_at > "2012-09-10"
AND p.created_at < "2012-11-10"
GROUP BY
pageview_url;

-- lift of 8.51$ per view of new billing page

-- Find number of sessions in the past month
SELECT
COUNT(DISTINCT website_session_id) AS sessions,
COUNT(DISTINCT website_session_id) * 8.51 AS Val_of_billing_test
FROM
website_pageviews
WHERE created_at BETWEEN "2012-10-27" and "2012-11-27"
AND pageview_url IN ('/billing', '/billing-2')


