Visualizing Sales Performance of a retail store business to give relevant insights.

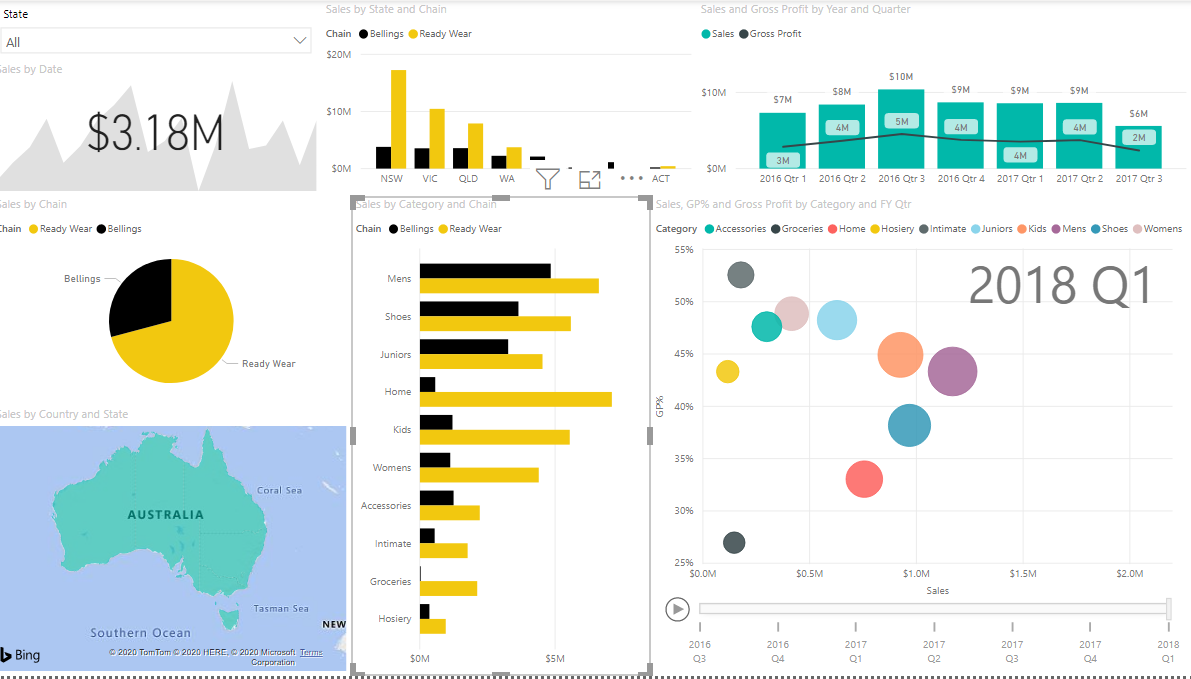
This is my first end to end power BI project in Power BI where I was able to use my skills and further explore the capabilities of Power BI. This project is all about retail sales data and summarizing their performance through visuals.
Article Index:
- Project Requirements.
- Why have I used a certain visual?
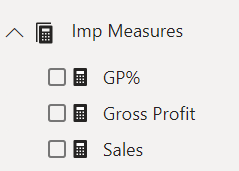
- DAX measures used.
- Formulas behind the DAX measures.
- Link to the data set.
- Refferences.
- Whats next?
1. Project Requirements:
| Parameter Visualized | Visual Used |
|---|---|
| Summary of all the business unit and their performance. | KPI Card |
| Sales by State and Chain. | Line and Stacked Column Chart |
| Sales & Gross Margin by financial Year quarters. | Scatter Chart with play axis |
| Sales by Chain. | Pie Chart |
| How diff state are performing through map. | Filled Map |
| Sales by category and chain. | Horizontal Bar graph |
2. Why have I used a certain visual?
| Visual | Why use this visual? |
|---|---|
| KPI Card | Used to show a key performace indicator. I was able to show the sales value and trend of sales. |
| Line and Stacked Column Chart | This chart is ideal for making comparisons and also show multiple parameters. |
| Scatter Chart with play axis | Scatter chart is ideal to show relation between data. The play axis creates a virtual timeline. |
| Pie Chart | This chart is ideal for showing composition of data having less categories. |
| Filled Map | Geospatial maps are ideal to show regions as a visual making a visual more interactive. |
| Horizontal Bar graph | This chart is also used for comparison. Sometimes the orientation plays a big role. |
3. DAX measures used:

4. Formulas behind the DAX measures.
| DAX measure | Formula used |
|---|---|
| Sales | SUMX(Sales1,Sales1[Total Units]* Sales1[Sale Price]) |
| Gross Profit | SUMX(Sales1,[Sales]-(Sales1[Cost Price] * Sales1[Total Units])) |
| Gross Profit % | DIVIDE([Gross Profit],[Sales]) * 100 |
5. Description of the DAX formula:
-
SUMX: Unlike the traditional SUM function the SUMX function performs column wise addition instead of row wise addition. This means that for each row a given expression is performed and then it is added to the next rows answer that is got from the given expression. Syntax: SUMX(table name, expression)
-
DIVIDE: Performs division operation. Syntax: DIVIDE(NUM,DEN,else value)
6. Refferences:
- This project was part of iNeuron’s community course for Power BI and Tableau.
7. Whats next?
- The next steps would be to publish the dashboard online.
- Create a refresh interval for the data by specifying the time.
- Assigning which user has access to what part of the dashboard.
