Converting Company Data into meaningful visualizations for Management Insights.

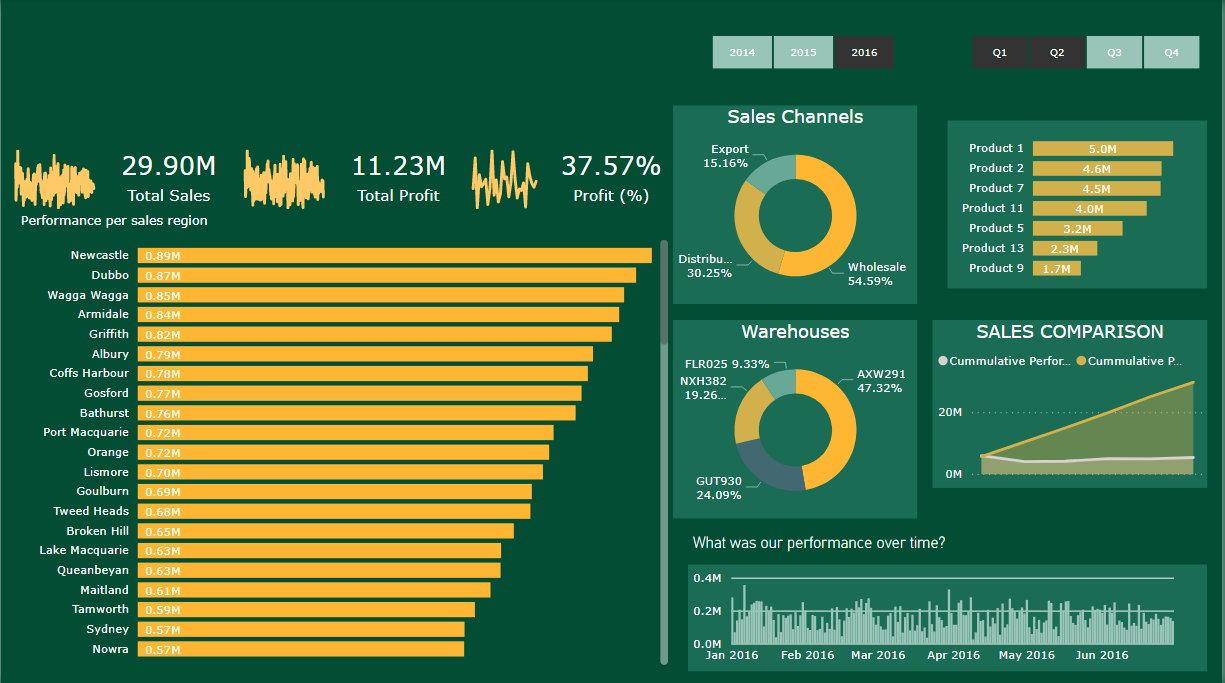
We are going to create visualizations for a scenario company showing management insghts that allow managers to make business decisions based on product popularity, sales by region and other parameters that can be seen in the visualizations.
Article Index:
- Project Requirements.
- Why have I used a certain visual?
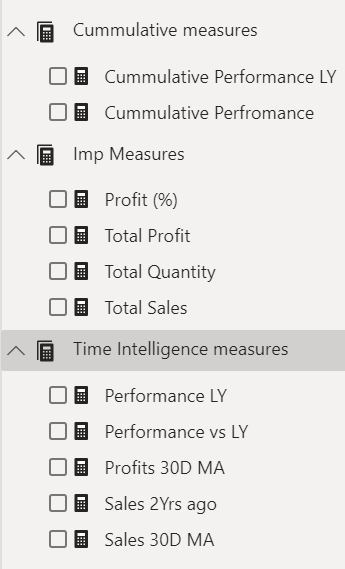
- DAX measures used.
- Formulas behind the DAX measures.
- Link to the data set.
- Refferences.
- Whats next?
1. Project Requirements:
Create a Date Table Created a Date table using CALENDER formula.
| Parameter Visualized | Visual Used |
|---|---|
| Create a Quarter and Year Slicer | Slicer (Orientation: Horizontal) |
| Total Sales | Card Visual |
| Profit | Card Visual |
| % Profit | Card Visual |
| Sales Comparison between Cumulative Performance vs Cumulative Performance LY | Area chart |
| Top 7 products | stacked bar chart |
| Performance sales per city | stacked bar chart |
2. Why have I used a certain visual?
| Visual Used | Why this Visual? |
|---|---|
| Slicer (Horizontal) | Slicer allows us to filter data on the dashboard by year and quarter. Switching to horizontal orientation gives us buttons. |
| Card Visual | The visual gives us the numerical value of the parameter. |
| Area Chart | Used to show how values develop over time. We can also get the trend of the data like from a line chart. |
| Stacked bar chart | Used to compare data. In this case we are comparing sales performance by region and products. |
3. DAX measures used:

4. Formulas behind the DAX measures.
| DAX measure | Formula used | |
|---|---|---|
| Cummulative Performance LY | CALCULATE(‘Cummulative measures’[Cummulative Perfromance],DATEADD(‘Date’[Date],-1,YEAR)) | |
| Cummulative Performance | CALCULATE([Total Sales],FILTER(ALLSELECTED(‘Date’),’Date’[Date]<=MAX(‘Date’[Date]))) | |
| Profit % | DIVIDE([Gross Profit],[Sales]) * 100 | |
| Total Profit | SUMX(Sales1,[Sales]-(Sales1[Cost Price] * Sales1[Total Units])) | |
| Total Quantity | SUMX(Sales, Sales[Order Quantity]) | |
| Total Sales | SUMX(Sales,Sales[Unit Price] * Sales[Order Quantity]) | |
| Performace LY | CALCULATE([Total Sales],DATEADD(‘Date’[Date],-1,YEAR)) | |
| Performance vs LY | CALCULATE([Total Sales]-[Performance LY]) | |
| Profits 30D MA | AVERAGEX(DATESINPERIOD(‘Date’[Date],LASTDATE(‘Date’[Date]),-30,DAY),[Total Profit]) | |
| Sales 2Yrs ago | CALCULATE([Total Sales],DATEADD(‘Date’[Date],-2,YEAR)) | |
| Sales 30D MA | AVERAGEX(DATESINPERIOD(‘Date’[Date],LASTDATE(‘Date’[Date]),-30,DAY),[Total Sales]) |
5. Description of the DAX formula:
-
SUMX: Unlike the traditional SUM function the SUMX function performs column wise addition instead of row wise addition. This means that for each row a given expression is performed and then it is added to the next rows answer that is got from the given expression. Syntax: SUMX(table name, expression)
-
DIVIDE: Performs division operation. Syntax: DIVIDE(NUM,DEN,else value)
-
CALCULATE: The calculate function will take any expression and allow us to apply a filter on it. If we consider te Cummulative performance calculated here, a filter is being applied on Total Sales such that the previous value gets added to the next one. If we take performance last year as another example, we are able to add a filter such that we will get the total sales value of the last year. Syntax: CALCULATE(Expression, Filter1)
-
FILTER: As the name suggests the Filter function will filter values on the specified table. Syntax: FILTER(Table,Expression)
-
DATEEADD: The DATEADD function in Power BI allows us to select a specific day, month or year and get data from that period. Syntax: DATEADD(Table column name, period, y/m/d)
-
AVERAGEX: Calculates the average of expressions in a specified table. Syntax: AVERAGEX(Table, Expression)
-
DATESINPERIOD: This function is similar to DATEADD but here it also allows you to pick a start date. Syntax: DATESINPERIOD(Date Table, start date, interval, y/m/d)
6. Refferences:
- This project was part of iNeuron’s community course for Power BI and Tableau.
7. Whats next?
- The next steps would be to publish the dashboard online.
- Create a refresh interval for the data by specifying the time.
- Assigning which user has access to what part of the dashboard.
