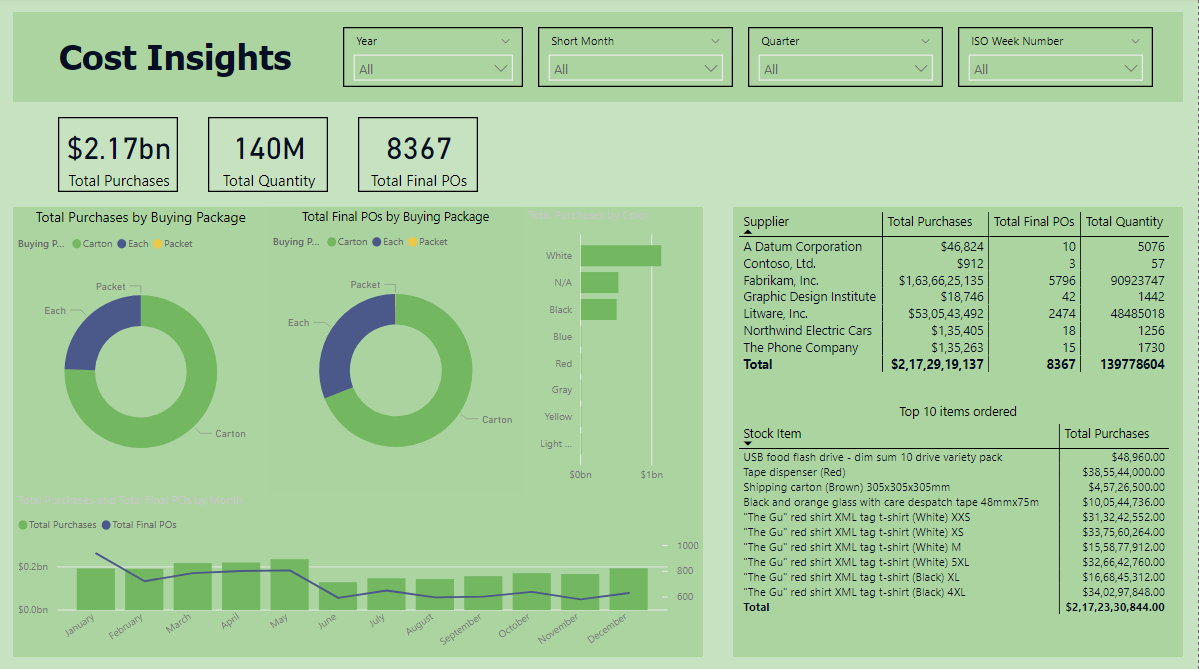
Creating visualizations to provide cost insights and manage inventory for miscellaneous items.

This project aims to use visualization to get insights of a company that if worked upon can save money to organisations and result in more efficient spending. The project here gives cost insights of a company using their purchase and stock records.
Article Index:
- Project Requirements.
- Why have I used a certain visual?
- DAX measures used.
- Formulas behind the DAX measures.
- Link to the data set.
- Refferences.
- Whats next?
1. Project Requirements:
| Parameter Visualized | Visual Used |
|---|---|
| Year | Slicer |
| Quarter | Slicer |
| Short Month | Slicer |
| ISO Week No. | Slicer |
| Total Purchase | Card Visual |
| Total Quantity | Card Visual |
| Total PO’s | Card Visual |
| Total Purchase by Buying Package | Donut Chart |
| Total PoS of Buying Package | Donut Chart |
| Total Purchase by Color | Vertical Bar Graph |
| Total Purchases & PoS by Month | Line & Cluster Column Chart |
| Table Showing Supplier, Total Purchase, Total PoS, Total Quantity | Matrix Table |
| Table Showing Top 10 Items ordered as Stock Item and Total Purchase | Matrix Table |
2. Why have I used a certain visual?
| Visual | Why use this visual? |
|---|---|
| Slicer | Allows us to filter on an entire page of a dashboard. The slicer presents the choices |
| Card Visual | Ideal to show static figures like total purchases, total quantity, profit % in this project. |
| Donut Chart | This chart is ideal for showing composition of data having less categories. |
| Vertical Bar graph | This chart is used for comparison within the data |
| Line and Stacked Column Chart | This chart is ideal for making comparisons and also show multiple parameters. |
| Matrix Table | A simple 2D table to represent certain values for a parameter. |
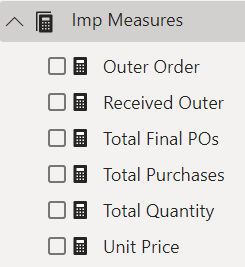
3. DAX measures used:

4. Formulas behind the DAX measures.
| DAX measure | Formula used |
|---|---|
| Outer Order | SUM(FactPurchase[Ordered Outers]) |
| Received ORder | SUM(FactPurchase[Received Outers]) |
| Total Final Po’s | COUNT(FactPurchase[WWI Purchase Order ID]) |
| Total Purchases | SUMX(DimStock,[Total Quantity] * [Unit Price]) |
| Total Quantity | SUM(FactPurchase[Ordered Quantity]) |
| Unit Price | SUM(FactSales[Unit Price]) |
5. Description of the DAX formula:
-
SUM: The SUM function takes the sum of an entire row and gives an output. Syntax: SUM(ColumnName)
-
SUMX: Unlike the traditional SUM function the SUMX function performs column wise addition instead of row wise addition. This means that for each row a given expression is performed and then it is added to the next rows answer that is got from the given expression. Syntax: SUMX(table name, expression)
-
COUNT: As the name suggest the COUNT function will give us the count of each value in a column that is specified. Syntax: COUNT(ColumnName)
6. Refferences:
- This project was part of iNeuron’s community course for Power BI and Tableau.
7. Whats next?
- The next steps would be to publish the dashboard online.
- Create a refresh interval for the data by specifying the time.
- Assigning which user has access to what part of the dashboard.
